6.1 Uniform Manifold Approximation and Projection (UMAP)
To run UMAP in ArchR we use the addUMAP() function:
projHeme2 <- addUMAP(
    ArchRProj = projHeme2,
    reducedDims = "IterativeLSI",
    name = "UMAP",
    nNeighbors = 30,
    minDist = 0.5,
    metric = "cosine"
)
## 09:50:55 UMAP embedding parameters a = 0.583 b = 1.334
## 09:50:56 Read 10251 rows and found 30 numeric columns
## 09:50:56 Using Annoy for neighbor search, n_neighbors = 30
## 09:50:57 Building Annoy index with metric = cosine, n_trees = 50
## 0% 10 20 30 40 50 60 70 80 90 100%
## [—-|—-|—-|—-|—-|—-|—-|—-|—-|—-|
## **************************************************|
## 09:50:59 Writing NN index file to temp file /tmp/RtmpXb8qQa/fileefeefe9c02c
## 09:50:59 Searching Annoy index using 10 threads, search_k = 3000
## 09:51:00 Annoy recall = 100%
## 09:51:01 Commencing smooth kNN distance calibration using 10 threads
## 09:51:03 Initializing from normalized Laplacian + noise
## 09:51:03 Commencing optimization for 200 epochs, with 467652 positive edges
## 09:51:14 Optimization finished
You can list the available embeddings objects in an ArchRProject using the slot extraction opperator @:
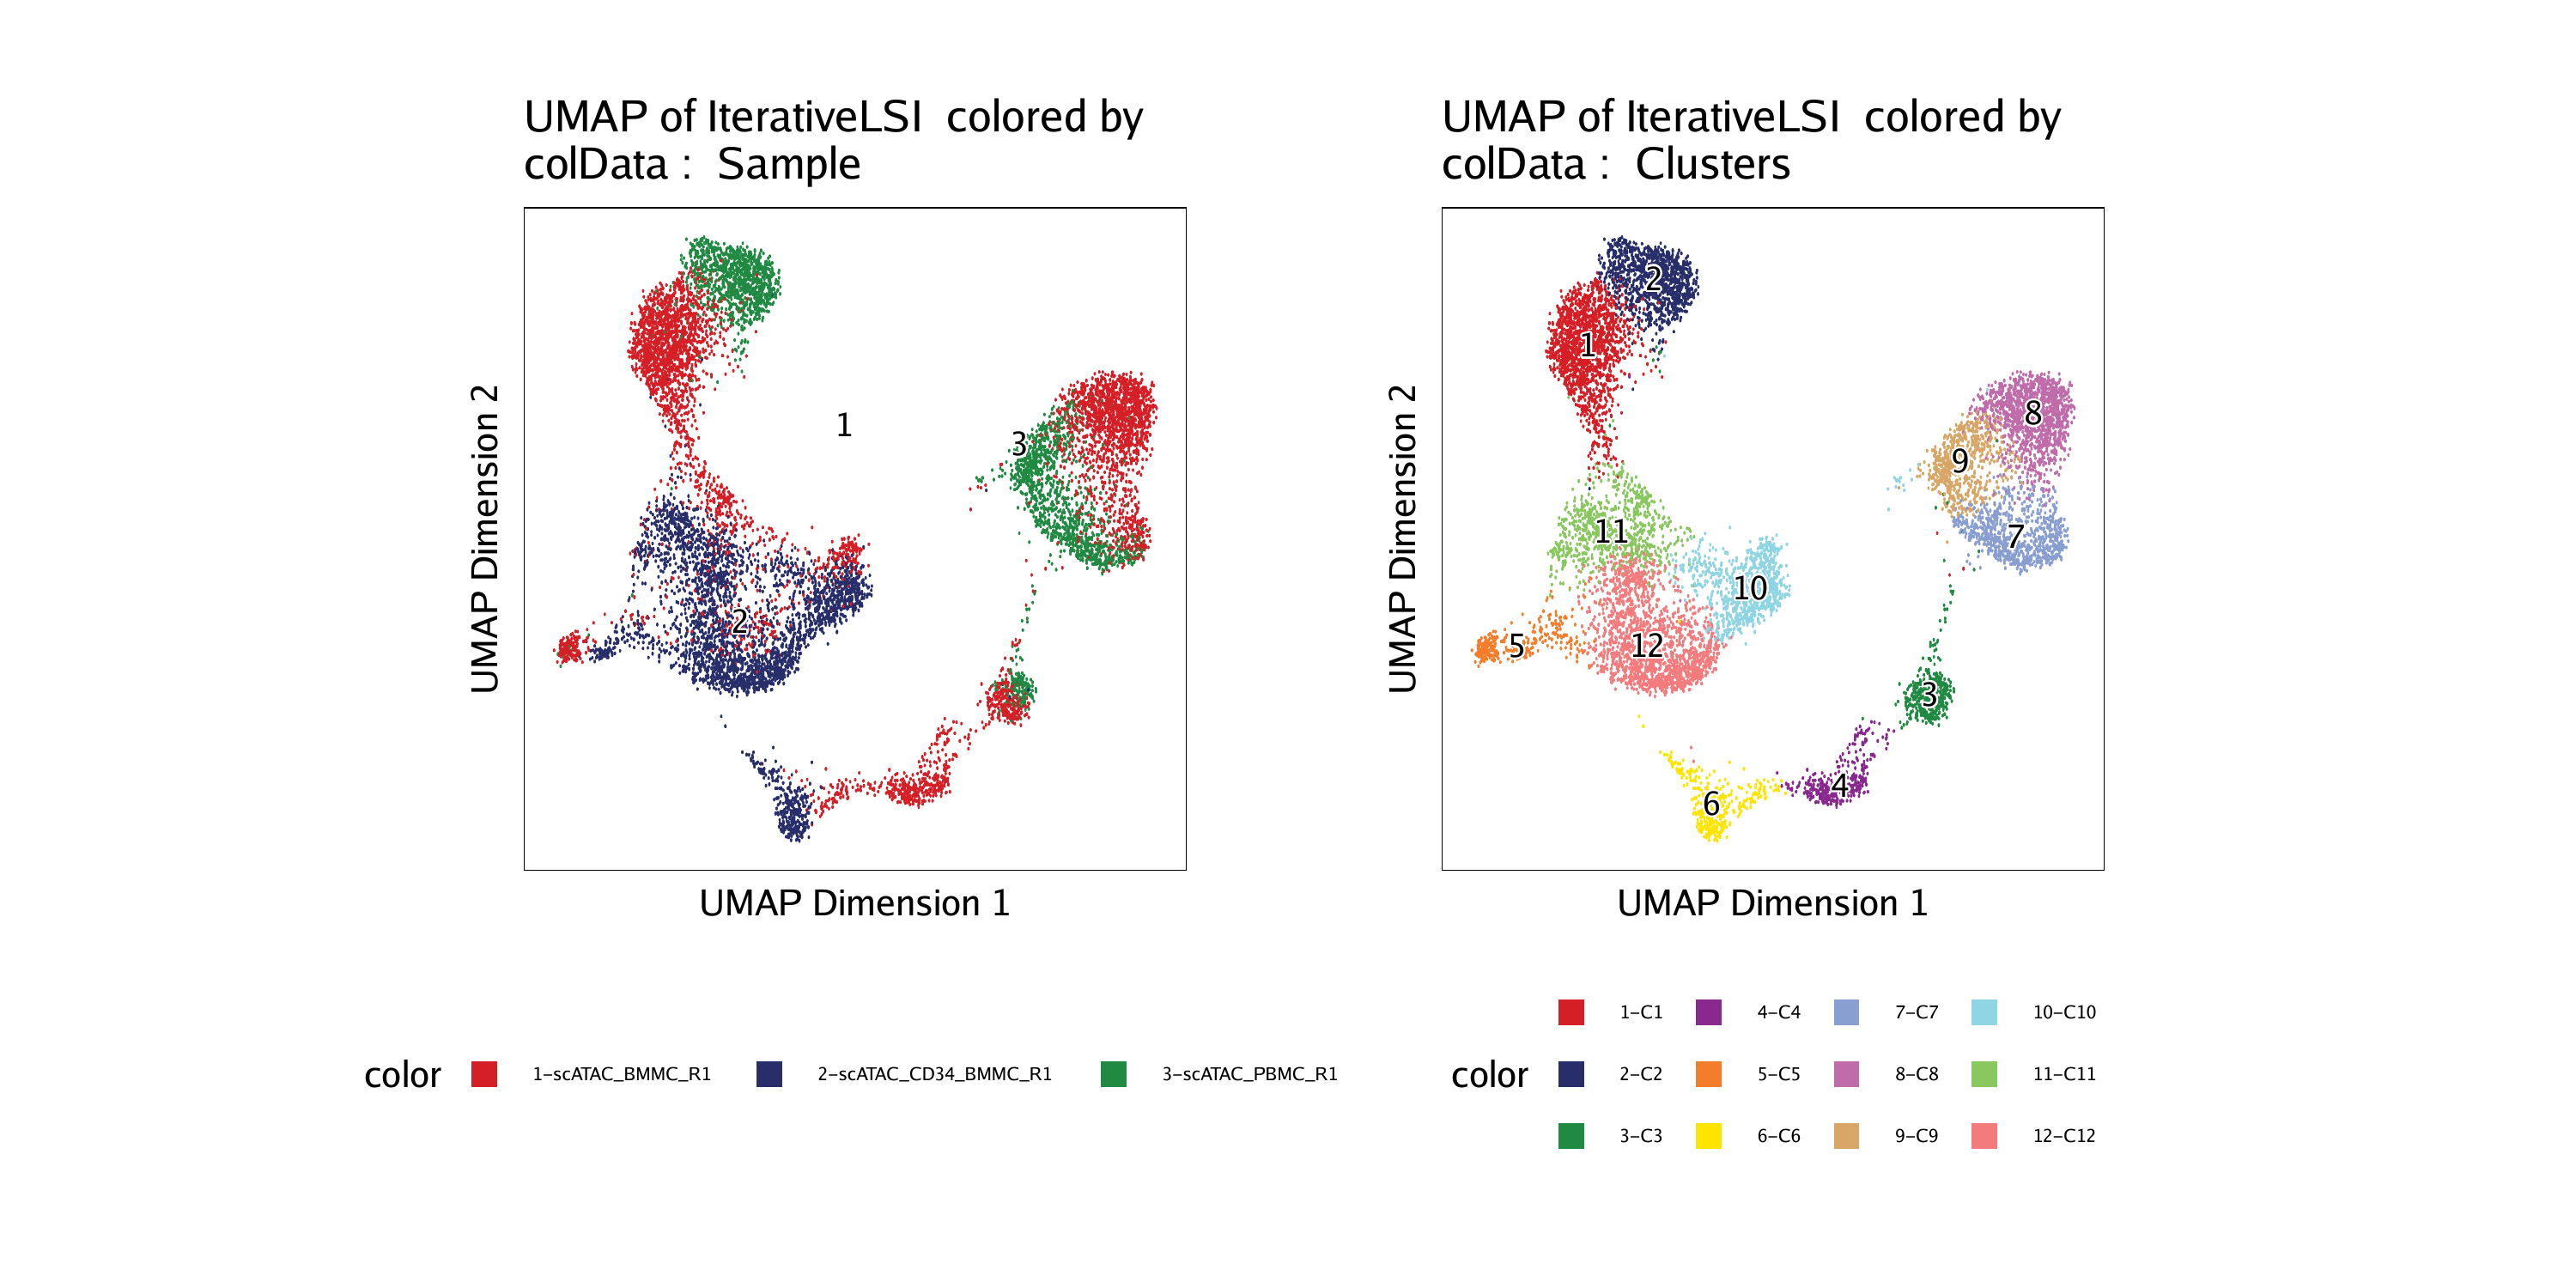
To plot the UMAP results, we use the plotEmbedding() function and pass the name of the UMAP embedding we just generated (“UMAP”). We can tell ArchR how to color the cells by using a combination of colorBy which tells ArchR which matrix to use to find the specified metadata column provided to name.
p1 <- plotEmbedding(ArchRProj = projHeme2, colorBy = "cellColData", name = "Sample", embedding = "UMAP")## ArchR logging to : ArchRLogs/ArchR-plotEmbedding-efee4e054106-Date-2020-04-15_Time-09-51-17.log
## If there is an issue, please report to github with logFile!
## Getting UMAP Embedding
## ColorBy = cellColData
## Plotting Embedding
## 1
## ArchR logging successful to : ArchRLogs/ArchR-plotEmbedding-efee4e054106-Date-2020-04-15_Time-09-51-17.log
Instead of coloring by “Sample” as above, we can color by “Clusters” which were identified in a previous chapter.
p2 <- plotEmbedding(ArchRProj = projHeme2, colorBy = "cellColData", name = "Clusters", embedding = "UMAP")## ArchR logging to : ArchRLogs/ArchR-plotEmbedding-efee3f232286-Date-2020-04-15_Time-09-51-18.log
## If there is an issue, please report to github with logFile!
## Getting UMAP Embedding
## ColorBy = cellColData
## Plotting Embedding
## 1
## ArchR logging successful to : ArchRLogs/ArchR-plotEmbedding-efee3f232286-Date-2020-04-15_Time-09-51-18.log
We can visualize these two plots side by side using the ggAlignPlots() function, specifying a horizontal orientation using type = "h".

To save an editable vectorized version of this plot, we use plotPDF().
plotPDF(p1,p2, name = "Plot-UMAP-Sample-Clusters.pdf", ArchRProj = projHeme2, addDOC = FALSE, width = 5, height = 5)## [1] “plotting ggplot!”
## [1] “plotting ggplot!”
## [1] 0
Download PDF : Plot-UMAP-Sample-Clusters.pdf
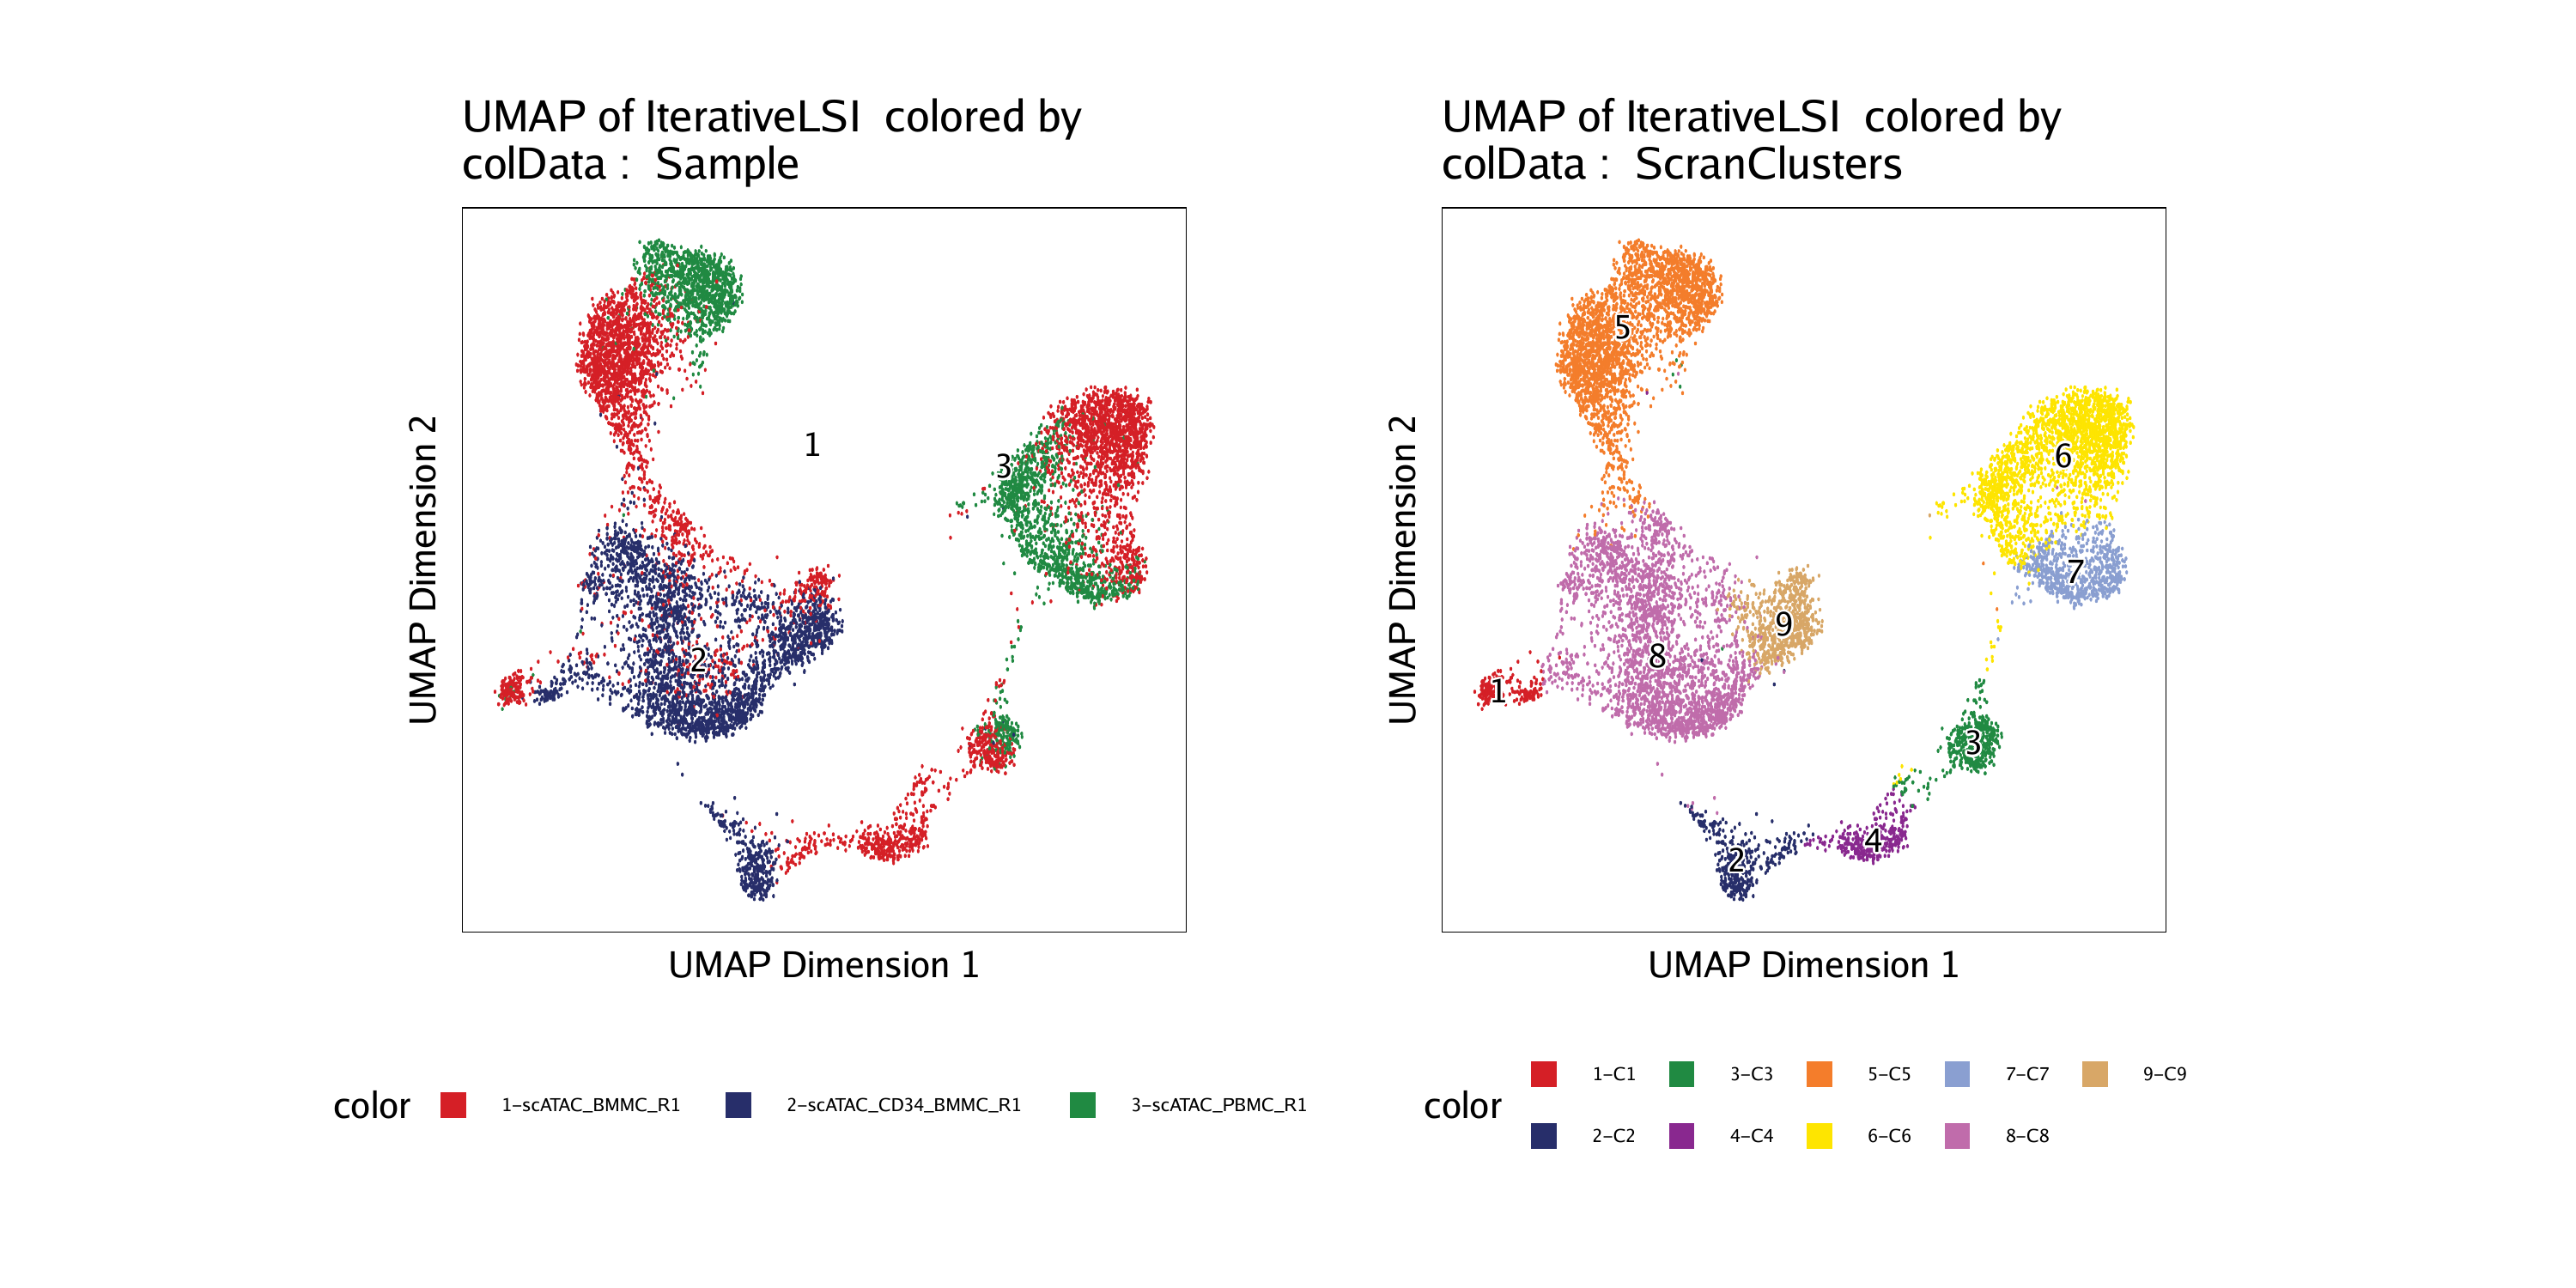
We can also use plotEmbedding() to visualize the results from clustering using scran:
p1 <- plotEmbedding(ArchRProj = projHeme2, colorBy = "cellColData", name = "Sample", embedding = "UMAP")## ArchR logging to : ArchRLogs/ArchR-plotEmbedding-efee6f4b8b88-Date-2020-04-15_Time-09-51-38.log
## If there is an issue, please report to github with logFile!
## Getting UMAP Embedding
## ColorBy = cellColData
## Plotting Embedding
## 1
## ArchR logging successful to : ArchRLogs/ArchR-plotEmbedding-efee6f4b8b88-Date-2020-04-15_Time-09-51-38.log
p2 <- plotEmbedding(ArchRProj = projHeme2, colorBy = "cellColData", name = "ScranClusters", embedding = "UMAP")## ArchR logging to : ArchRLogs/ArchR-plotEmbedding-efee6c73b6da-Date-2020-04-15_Time-09-51-39.log
## If there is an issue, please report to github with logFile!
## Getting UMAP Embedding
## ColorBy = cellColData
## Plotting Embedding
## 1
## ArchR logging successful to : ArchRLogs/ArchR-plotEmbedding-efee6c73b6da-Date-2020-04-15_Time-09-51-39.log

To save an editable vectorized version of this plot, we use plotPDF().
plotPDF(p1,p2, name = "Plot-UMAP-Sample-ScranClusters.pdf", ArchRProj = projHeme2, addDOC = FALSE, width = 5, height = 5)## [1] “plotting ggplot!”
## [1] “plotting ggplot!”
## [1] 0