11.3 Pairwise Testing Between Groups
Marker feature identification is a very specific type of differential test. However, ArchR also enables standard differential testing using the same getMarkerFeatures() function. The trick is to set useGroups to one of the two cell groups and bgdGroups to the other cell group. This performs a differential test between the two provided groups. In all of these differential tests, the peaks that are higher in the group passed to useGroups will have positive fold change values while the peaks that are higher in the group passed to bgdGroups will have negative fold change values.
Here we perform a pairwise test between the “Erythroid” cell group and the “Progenitor” cell group.
markerTest <- getMarkerFeatures(
  ArchRProj = projHeme5,
  useMatrix = "PeakMatrix",
  groupBy = "Clusters2",
  testMethod = "wilcoxon",
  bias = c("TSSEnrichment", "log10(nFrags)"),
  useGroups = "Erythroid",
  bgdGroups = "Progenitor"
)
## ArchR logging to : ArchRLogs/ArchR-getMarkerFeatures-ff9f77b592d7-Date-2020-04-15_Time-10-35-37.log
## If there is an issue, please report to github with logFile!
## MatrixClass = Sparse.Integer.Matrix
## 2020-04-15 10:35:41 : Matching Known Biases, 0.057 mins elapsed.
##
## 2020-04-15 10:35:44 : Computing Pairwise Tests (1 of 1), 0.107 mins elapsed.
## ###########
## 2020-04-15 10:36:13 : Completed Pairwise Tests, 0.584 mins elapsed.
## ###########
## ArchR logging successful to : ArchRLogs/ArchR-getMarkerFeatures-ff9f77b592d7-Date-2020-04-15_Time-10-35-37.log
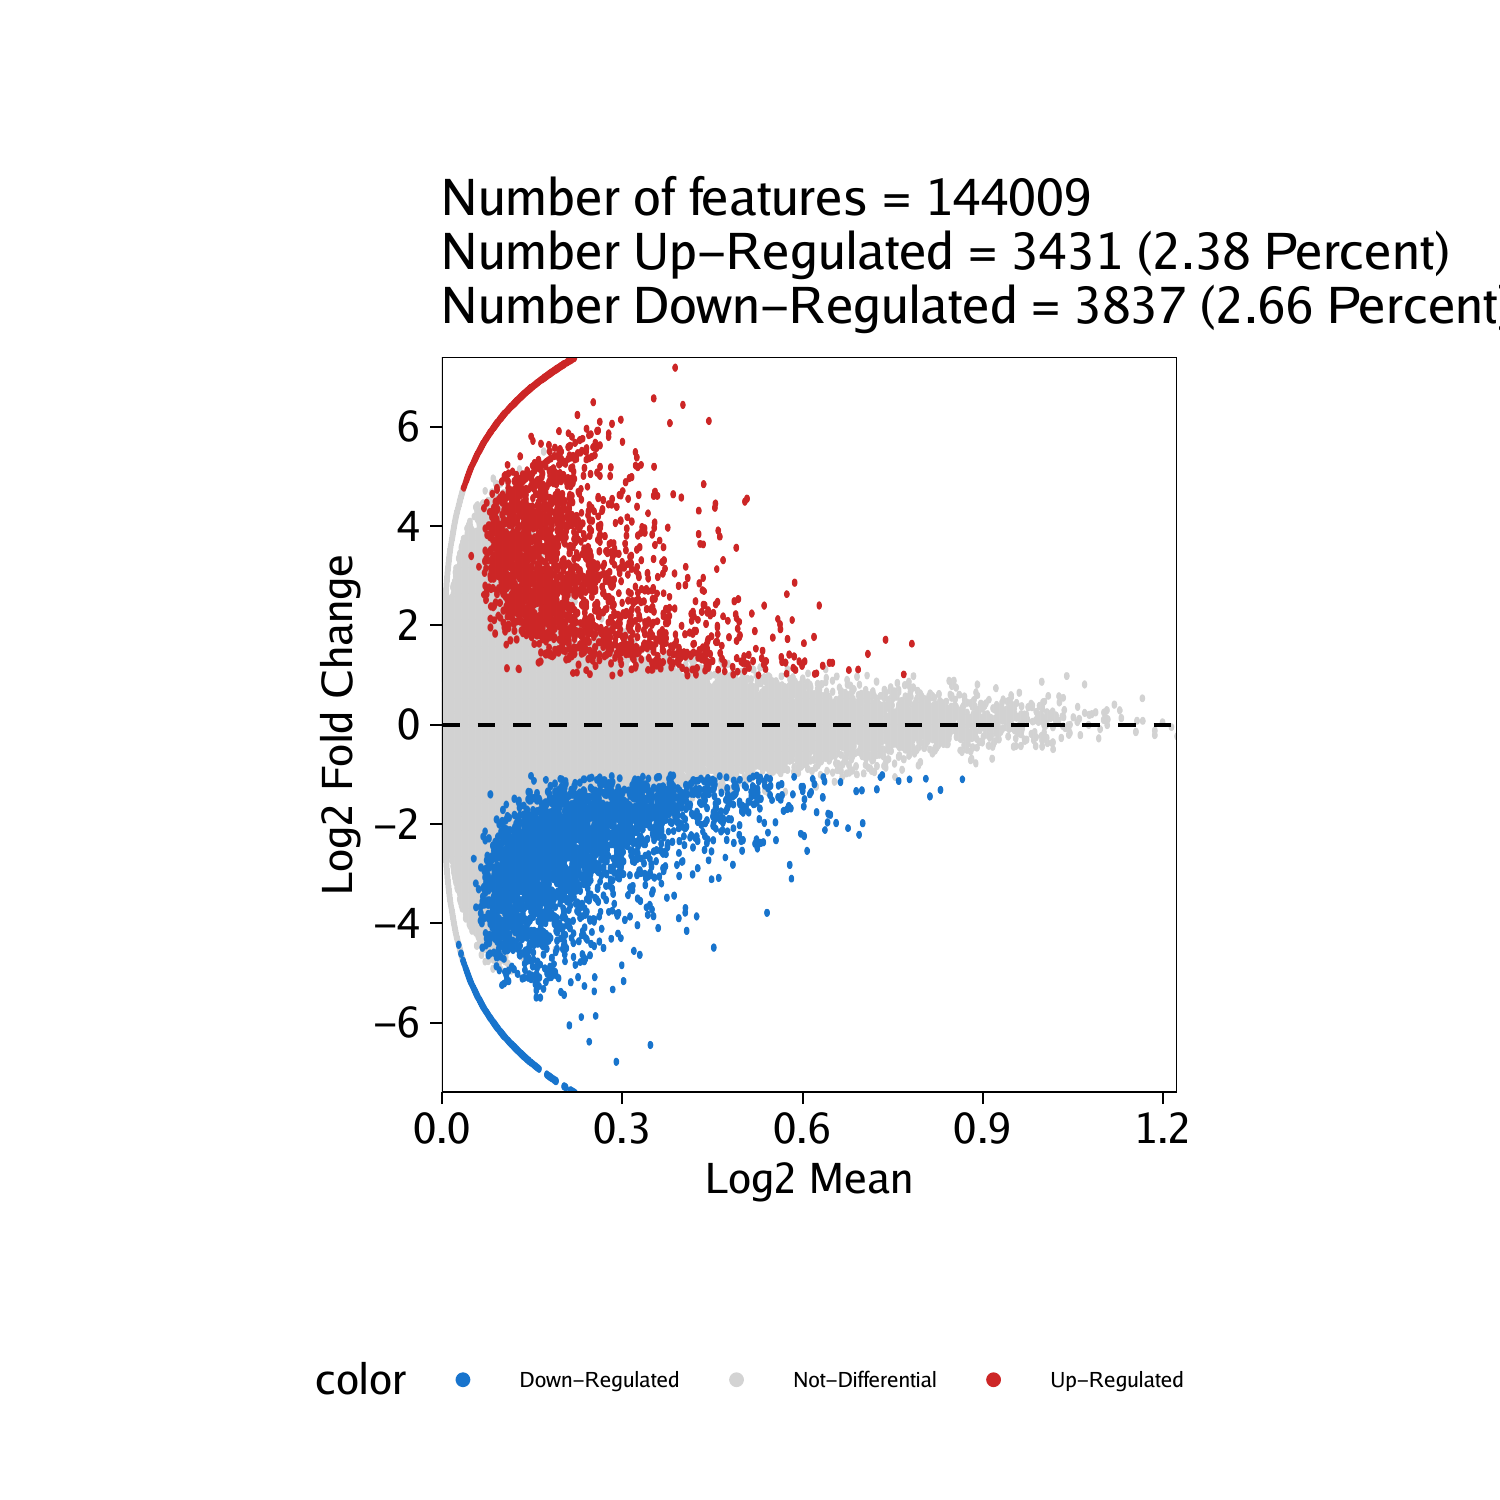
We can then plot an MA or Volcano plot using the markerPlot() function. We indicate an MA plot using plotAs = "MA".
pma <- markerPlot(seMarker = markerTest, name = "Erythroid", cutOff = "FDR <= 0.1 & abs(Log2FC) >= 1", plotAs = "MA")
pma
## Warning: Removed 57 rows containing missing values (geom_point_rast).

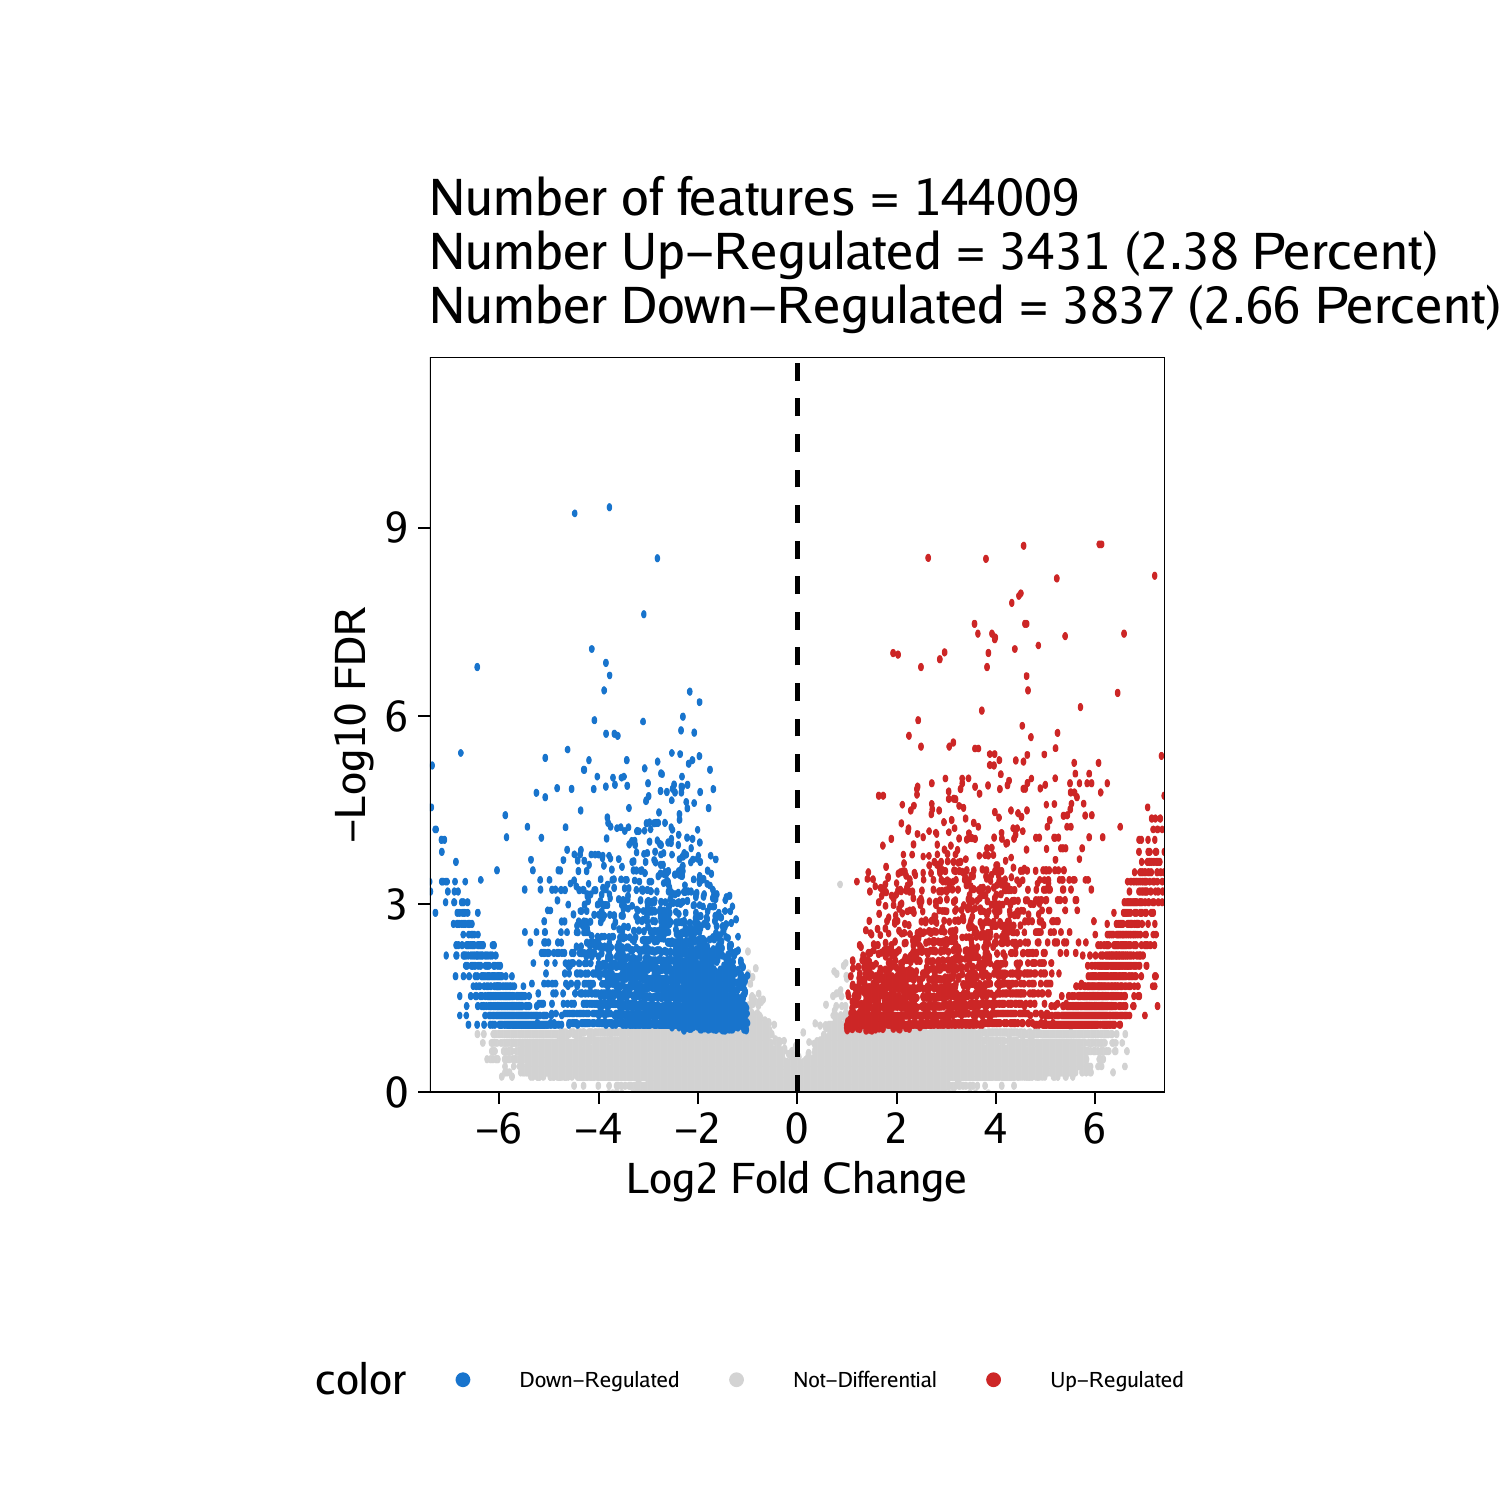
Similarly, we plot a volvano plot using plotAs = "Volcano".
pv <- markerPlot(seMarker = markerTest, name = "Erythroid", cutOff = "FDR <= 0.1 & abs(Log2FC) >= 1", plotAs = "Volcano")
pv
## Warning: Removed 57 rows containing missing values (geom_point_rast).

To save an editable vectorized version of these plots, we use the plotPDF() function.
plotPDF(pma, pv, name = "Erythroid-vs-Progenitor-Markers-MA-Volcano", width = 5, height = 5, ArchRProj = projHeme5, addDOC = FALSE)## [1] “plotting ggplot!”
## Warning: Removed 57 rows containing missing values (geom_point_rast).
## Warning: Removed 57 rows containing missing values (geom_point_rast).
## [1] “plotting ggplot!”
## Warning: Removed 57 rows containing missing values (geom_point_rast).
## Warning: Removed 57 rows containing missing values (geom_point_rast).
## [1] 0
We will continue this differential analysis in the next chapter by looking for motif enrichments in our differentially accessible peaks.