12.4 Custom Enrichment
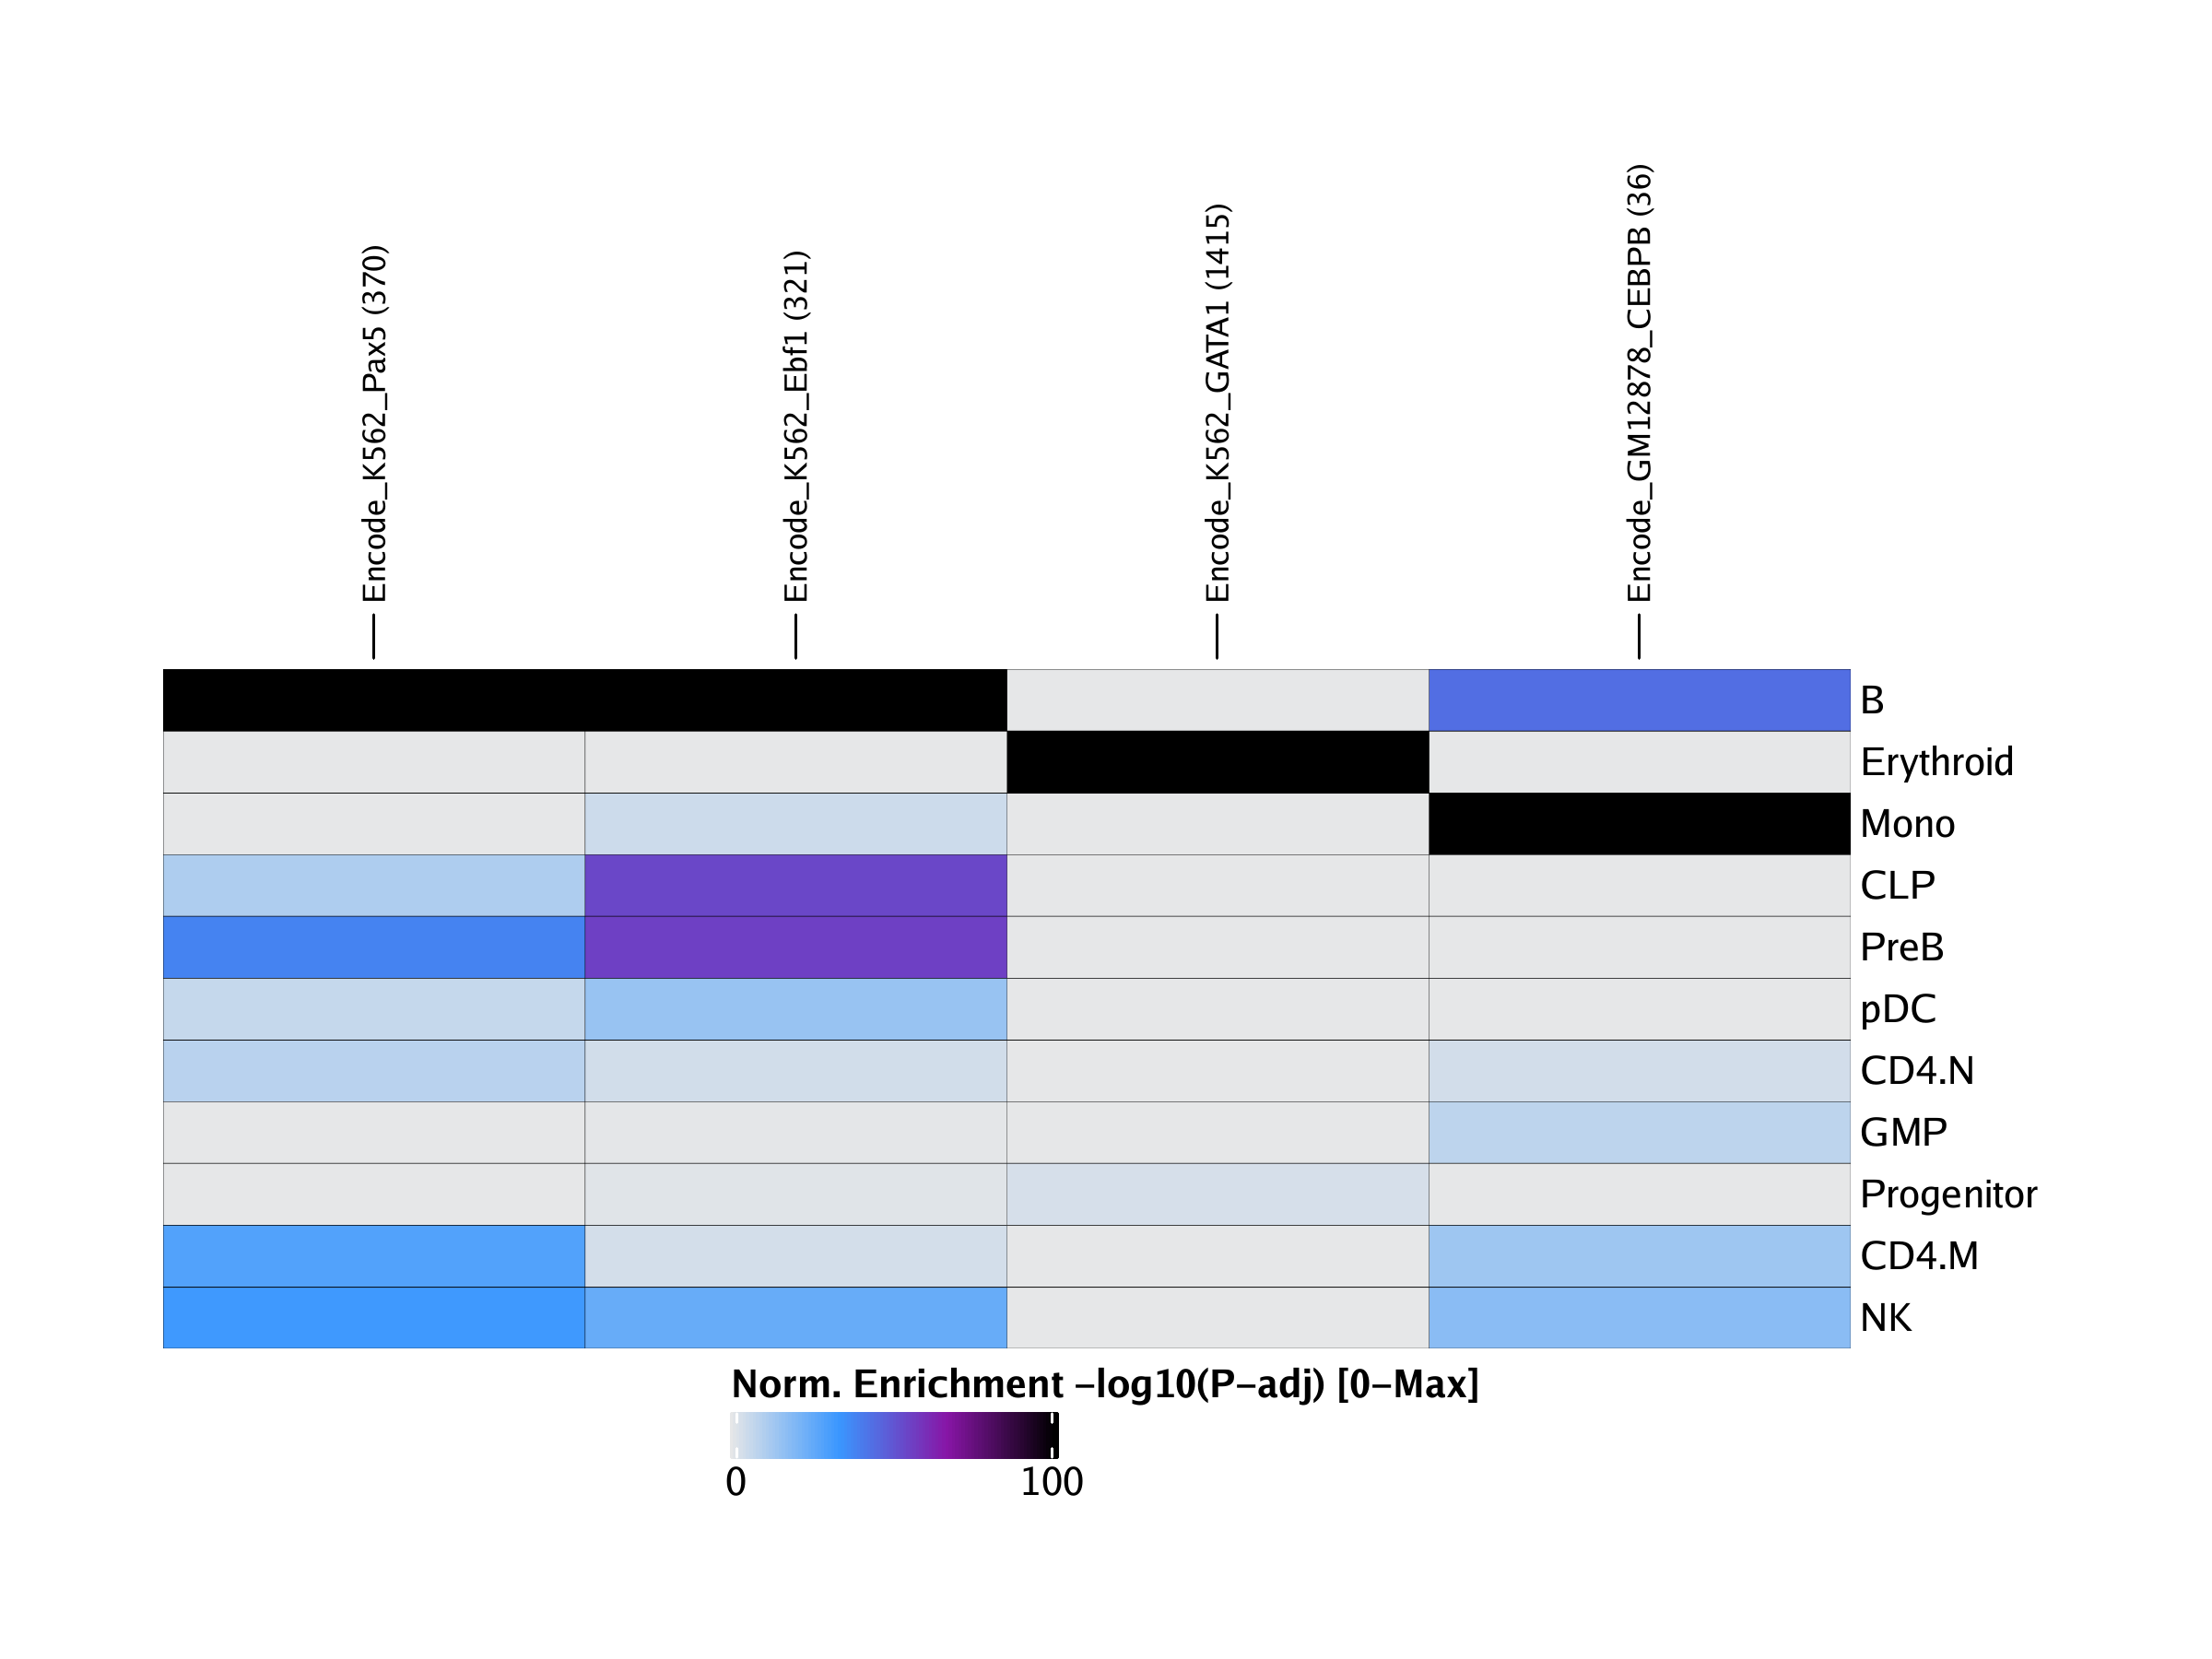
In addition to all of these curated annotation sets, ArchR is also capable of accepting user-defined annotations to perform custom enrichments. In the below example, we illustrate how to create a custom annotation based on select ENCODE ChIP-seq experiments.
First, we will define the datasets that will be used and provide links for their download. Local files could be used in the same way.
EncodePeaks <- c(
  Encode_K562_GATA1 = "https://www.encodeproject.org/files/ENCFF632NQI/@@download/ENCFF632NQI.bed.gz",
  Encode_GM12878_CEBPB = "https://www.encodeproject.org/files/ENCFF761MGJ/@@download/ENCFF761MGJ.bed.gz",
  Encode_K562_Ebf1 = "https://www.encodeproject.org/files/ENCFF868VSY/@@download/ENCFF868VSY.bed.gz",
  Encode_K562_Pax5 = "https://www.encodeproject.org/files/ENCFF339KUO/@@download/ENCFF339KUO.bed.gz"
)
We then add a custom annotation to our ArchRProject using the addPeakAnnotation() function. Here, we call our custom annotation “ChIP”.
## 2020-04-15 10:44:23 : Creating Peak Overlap Matrix, 0.036 mins elapsed.
As before, we use this custom annotation to perform the peak annotation enrichment using peakAnnoEnrichment() and follow the same steps to create our annotation heatmap.
enrichRegions <- peakAnnoEnrichment(
    seMarker = markersPeaks,
    ArchRProj = projHeme5,
    peakAnnotation = "ChIP",
    cutOff = "FDR <= 0.1 & Log2FC >= 0.5"
  )
## 2020-04-15 10:44:25 : Computing Enrichments 1 of 11, 0.027 mins elapsed.
## 2020-04-15 10:44:25 : Computing Enrichments 2 of 11, 0.027 mins elapsed.
## 2020-04-15 10:44:25 : Computing Enrichments 3 of 11, 0.027 mins elapsed.
## 2020-04-15 10:44:25 : Computing Enrichments 4 of 11, 0.028 mins elapsed.
## 2020-04-15 10:44:25 : Computing Enrichments 5 of 11, 0.028 mins elapsed.
## 2020-04-15 10:44:25 : Computing Enrichments 6 of 11, 0.029 mins elapsed.
## 2020-04-15 10:44:25 : Computing Enrichments 7 of 11, 0.029 mins elapsed.
## 2020-04-15 10:44:25 : Computing Enrichments 8 of 11, 0.03 mins elapsed.
## 2020-04-15 10:44:25 : Computing Enrichments 9 of 11, 0.03 mins elapsed.
## 2020-04-15 10:44:25 : Computing Enrichments 10 of 11, 0.03 mins elapsed.
## 2020-04-15 10:44:26 : Computing Enrichments 11 of 11, 0.033 mins elapsed.
## class: SummarizedExperiment ## dim: 4 11 ## metadata(0): ## assays(10): mlog10Padj mlog10p … CompareFrequency feature ## rownames(4): Encode_K562_GATA1 Encode_GM12878_CEBPB Encode_K562_Ebf1 ## Encode_K562_Pax5 ## rowData names(0): ## colnames(11): B CD4.M … PreB Progenitor ## colData names(0):
## Adding Annotations..
## Preparing Main Heatmap..

To save an editable vectorized version of this plot, we use the plotPDF() function.
plotPDF(heatmapRegions, name = "Regions-Enriched-Marker-Heatmap", width = 8, height = 6, ArchRProj = projHeme5, addDOC = FALSE)## [1] 0