7.6 Track Plotting with ArchRBrowser
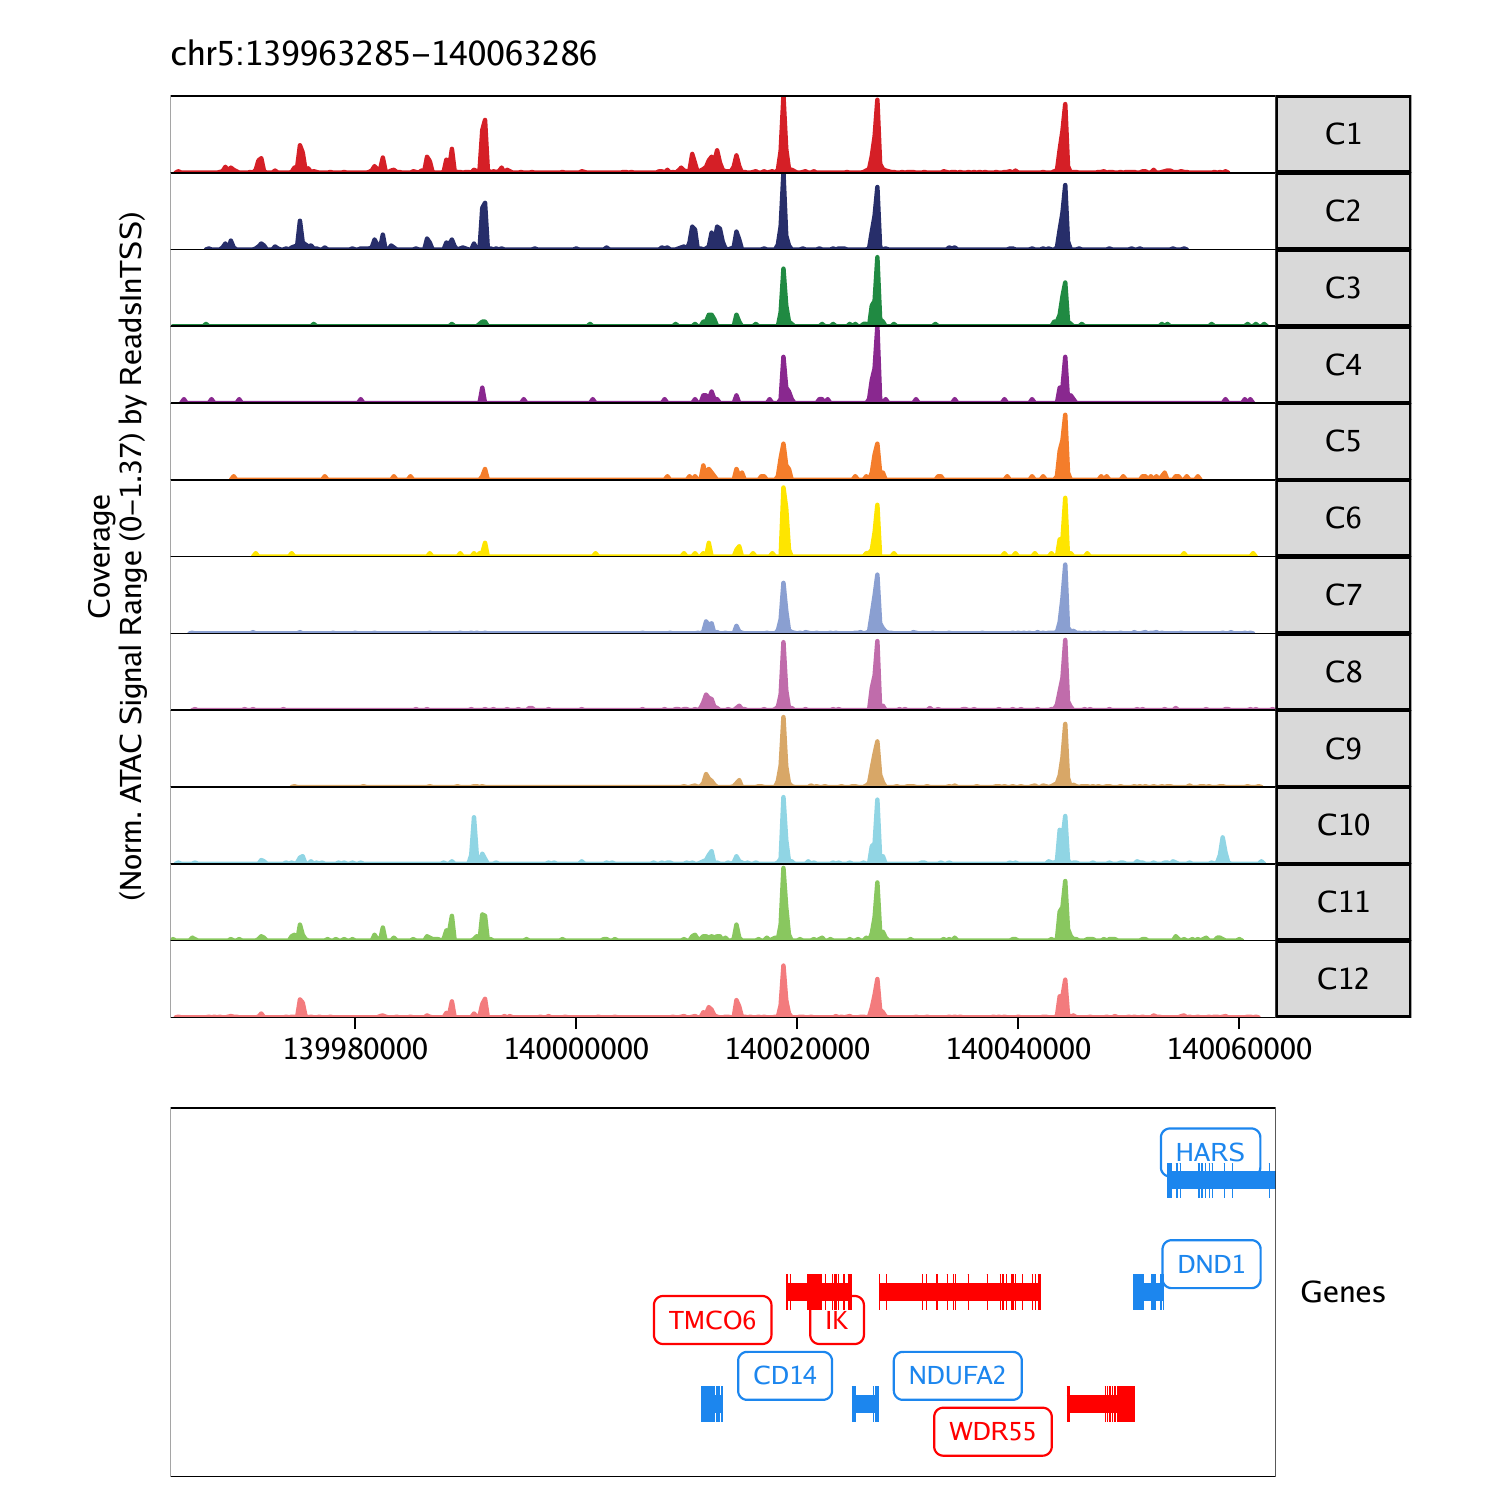
In addition to plotting gene scores per cell as a UMAP overlay, we can browse the local chromatin accessibility at these marker genes on a per cluster basis with genome browser tracks. To do this, we use the plotBrowserTrack() function which will create a list of plots, one for each of the genes specified by markerGenes. This function will plot a single track for each group in the groupBy parameter.
markerGenes  <- c(
    "CD34", #Early Progenitor
    "GATA1", #Erythroid
    "PAX5", "MS4A1", #B-Cell Trajectory
    "CD14", #Monocytes
    "CD3D", "CD8A", "TBX21", "IL7R" #TCells
  )

p <- plotBrowserTrack(
    ArchRProj = projHeme2,
    groupBy = "Clusters",
    geneSymbol = markerGenes,
    upstream = 50000,
    downstream = 50000
)
## ArchR logging to : ArchRLogs/ArchR-plotBrowserTrack-f4e46f9da45e-Date-2020-04-15_Time-10-07-24.log
## If there is an issue, please report to github with logFile!
## 2020-04-15 10:07:24 : Validating Region, 0.006 mins elapsed.
## GRanges object with 9 ranges and 2 metadata columns:
## seqnames ranges strand | gene_id symbol
##|
## [1] chr1 208059883-208084683 - | 947 CD34
## [2] chrX 48644982-48652717 + | 2623 GATA1
## [3] chr9 36838531-37034476 - | 5079 PAX5
## [4] chr11 60223282-60238225 + | 931 MS4A1
## [5] chr5 140011313-140013286 - | 929 CD14
## [6] chr11 118209789-118213459 - | 915 CD3D
## [7] chr2 87011728-87035519 - | 925 CD8A
## [8] chr17 45810610-45823485 + | 30009 TBX21
## [9] chr5 35856977-35879705 + | 3575 IL7R
## ——-
## seqinfo: 24 sequences from hg19 genome
## 2020-04-15 10:07:25 : Adding Bulk Tracks (1 of 9), 0.009 mins elapsed.
## 2020-04-15 10:07:27 : Adding Gene Tracks (1 of 9), 0.044 mins elapsed.
## 2020-04-15 10:07:27 : Plotting, 0.054 mins elapsed.
## 2020-04-15 10:07:29 : Adding Bulk Tracks (2 of 9), 0.09 mins elapsed.
## 2020-04-15 10:07:31 : Adding Gene Tracks (2 of 9), 0.108 mins elapsed.
## 2020-04-15 10:07:31 : Plotting, 0.117 mins elapsed.
## 2020-04-15 10:07:34 : Adding Bulk Tracks (3 of 9), 0.157 mins elapsed.
## 2020-04-15 10:07:35 : Adding Gene Tracks (3 of 9), 0.175 mins elapsed.
## 2020-04-15 10:07:35 : Plotting, 0.183 mins elapsed.
## 2020-04-15 10:07:37 : Adding Bulk Tracks (4 of 9), 0.221 mins elapsed.
## 2020-04-15 10:07:38 : Adding Gene Tracks (4 of 9), 0.239 mins elapsed.
## 2020-04-15 10:07:39 : Plotting, 0.249 mins elapsed.
## 2020-04-15 10:07:41 : Adding Bulk Tracks (5 of 9), 0.279 mins elapsed.
## 2020-04-15 10:07:42 : Adding Gene Tracks (5 of 9), 0.295 mins elapsed.
## 2020-04-15 10:07:42 : Plotting, 0.301 mins elapsed.
## 2020-04-15 10:07:44 : Adding Bulk Tracks (6 of 9), 0.339 mins elapsed.
## 2020-04-15 10:07:46 : Adding Gene Tracks (6 of 9), 0.358 mins elapsed.
## 2020-04-15 10:07:46 : Plotting, 0.367 mins elapsed.
## 2020-04-15 10:07:49 : Adding Bulk Tracks (7 of 9), 0.409 mins elapsed.
## 2020-04-15 10:07:50 : Adding Gene Tracks (7 of 9), 0.429 mins elapsed.
## 2020-04-15 10:07:50 : Plotting, 0.44 mins elapsed.
## 2020-04-15 10:07:54 : Adding Bulk Tracks (8 of 9), 0.502 mins elapsed.
## 2020-04-15 10:07:55 : Adding Gene Tracks (8 of 9), 0.52 mins elapsed.
## 2020-04-15 10:07:56 : Plotting, 0.528 mins elapsed.
## 2020-04-15 10:07:58 : Adding Bulk Tracks (9 of 9), 0.567 mins elapsed.
## 2020-04-15 10:07:59 : Adding Gene Tracks (9 of 9), 0.585 mins elapsed.
## 2020-04-15 10:08:00 : Plotting, 0.593 mins elapsed.
## ArchR logging successful to : ArchRLogs/ArchR-plotBrowserTrack-f4e46f9da45e-Date-2020-04-15_Time-10-07-24.log
To plot a track of a specific gene, we can select one from the list.

We can save a multi-page PDF with a single page for each gene locus in our plot list using the plotPDF() function.
plotPDF(plotList = p,
    name = "Plot-Tracks-Marker-Genes.pdf",
    ArchRProj = projHeme2,
    addDOC = FALSE, width = 5, height = 5)
## NULL
## NULL
## NULL
## NULL
## NULL
## NULL
## NULL
## NULL
## NULL
## [1] 0