17.2 Co-accessibility with ArchR
Co-accessibility is a correlation in accessibility between two peaks across many single cells. Said another way, when Peak A is accessible in a single cell, Peak B is often also accessible. We illustrate this concept visually below, showing that Enhancer E3 is often co-accessible with Promoter P.
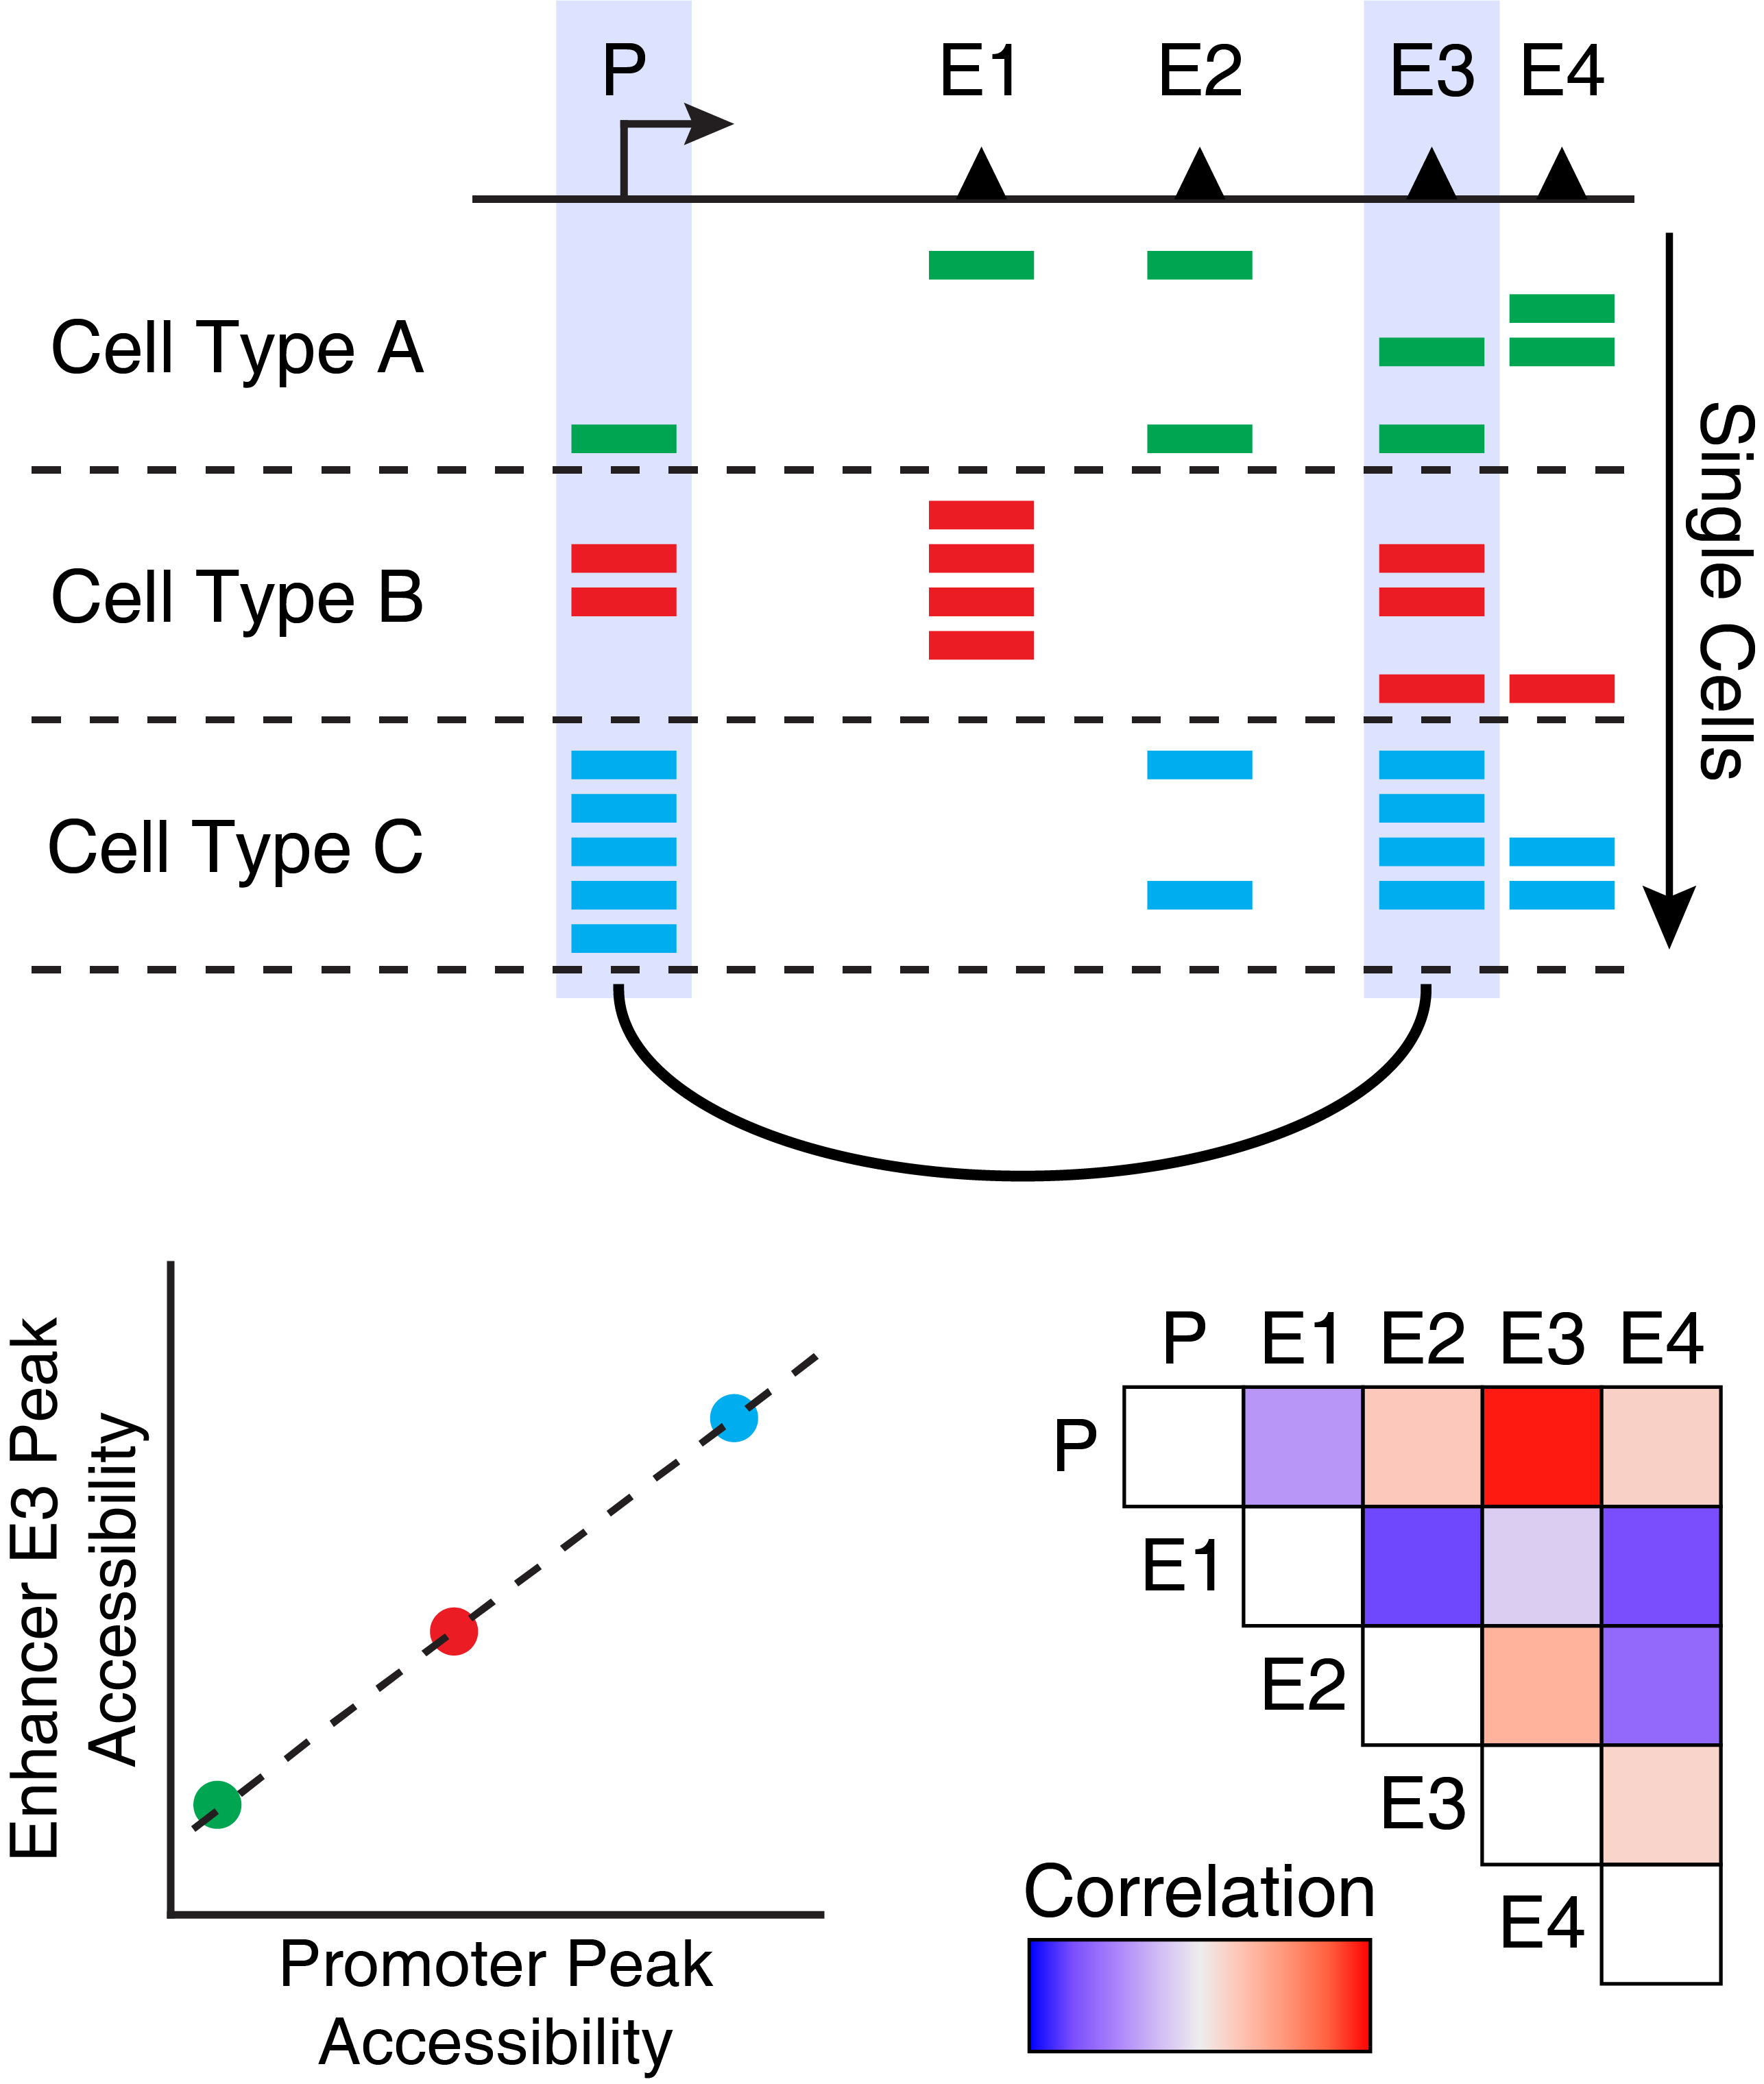
One thing to note about co-accessibility analysis is that it often identified cell type-specific peaks as being co-accessibile. This is because these peaks are often all accessible together within a single cell type and often all not accessible in all other cell types. This drives a strong correlation but does not necessarily mean that there is a regulatory relationship between these peaks.
To calculate co-accessibility in ArchR, we use the addCoAccessibility() function which stores peak co-accessibility information in the ArchRProject.
projHeme5 <- addCoAccessibility(
    ArchRProj = projHeme5,
    reducedDims = "IterativeLSI"
)
## ArchR logging to : ArchRLogs/ArchR-addCoAccessibility-95f3509d5-Date-2025-02-06_Time-02-43-51.08169.log
## If there is an issue, please report to github with logFile!
## 2025-02-06 02:43:51.485349 : Computing KNN, 0.007 mins elapsed.
## 2025-02-06 02:43:51.577353 : Identifying Non-Overlapping KNN pairs, 0.008 mins elapsed.
## 2025-02-06 02:43:53.188808 : Identified 493 Groupings!, 0.035 mins elapsed.
## 2025-02-06 02:43:59.113994 : Computing Co-Accessibility chr1 (1 of 23), 0.134 mins elapsed.
## 2025-02-06 02:44:08.313653 : Computing Co-Accessibility chr2 (2 of 23), 0.287 mins elapsed.
## 2025-02-06 02:44:16.727436 : Computing Co-Accessibility chr3 (3 of 23), 0.427 mins elapsed.
## 2025-02-06 02:44:22.750216 : Computing Co-Accessibility chr4 (4 of 23), 0.528 mins elapsed.
## 2025-02-06 02:44:30.307904 : Computing Co-Accessibility chr5 (5 of 23), 0.654 mins elapsed.
## 2025-02-06 02:44:38.259914 : Computing Co-Accessibility chr6 (6 of 23), 0.786 mins elapsed.
## 2025-02-06 02:44:46.356375 : Computing Co-Accessibility chr7 (7 of 23), 0.921 mins elapsed.
## 2025-02-06 02:44:52.348607 : Computing Co-Accessibility chr8 (8 of 23), 1.021 mins elapsed.
## 2025-02-06 02:45:00.122384 : Computing Co-Accessibility chr9 (9 of 23), 1.151 mins elapsed.
## 2025-02-06 02:45:07.99718 : Computing Co-Accessibility chr10 (10 of 23), 1.282 mins elapsed.
## 2025-02-06 02:45:15.911764 : Computing Co-Accessibility chr11 (11 of 23), 1.414 mins elapsed.
## 2025-02-06 02:45:21.912721 : Computing Co-Accessibility chr12 (12 of 23), 1.514 mins elapsed.
## 2025-02-06 02:45:29.983331 : Computing Co-Accessibility chr13 (13 of 23), 1.648 mins elapsed.
## 2025-02-06 02:45:37.448417 : Computing Co-Accessibility chr14 (14 of 23), 1.773 mins elapsed.
## 2025-02-06 02:45:45.167054 : Computing Co-Accessibility chr15 (15 of 23), 1.901 mins elapsed.
## 2025-02-06 02:45:50.757761 : Computing Co-Accessibility chr16 (16 of 23), 1.995 mins elapsed.
## 2025-02-06 02:45:58.610244 : Computing Co-Accessibility chr17 (17 of 23), 2.125 mins elapsed.
## 2025-02-06 02:46:06.855097 : Computing Co-Accessibility chr18 (18 of 23), 2.263 mins elapsed.
## 2025-02-06 02:46:14.226 : Computing Co-Accessibility chr19 (19 of 23), 2.386 mins elapsed.
## 2025-02-06 02:46:20.553265 : Computing Co-Accessibility chr20 (20 of 23), 2.491 mins elapsed.
## 2025-02-06 02:46:28.219289 : Computing Co-Accessibility chr21 (21 of 23), 2.619 mins elapsed.
## 2025-02-06 02:46:35.541425 : Computing Co-Accessibility chr22 (22 of 23), 2.741 mins elapsed.
## 2025-02-06 02:46:43.061872 : Computing Co-Accessibility chrX (23 of 23), 2.866 mins elapsed.
## ArchR logging successful to : ArchRLogs/ArchR-addCoAccessibility-95f3509d5-Date-2025-02-06_Time-02-43-51.08169.log
If you aim to only perform co-accessibility analyses on a subset of cells in your project, you can specify which cells should be analyzed using the cellsToUse parameter. There are other important parameters to keep in mind depending on the precise composition of your own data. For example, the k parameter designates how many cells should be included in the low-overlapping cell groups for correlation analysis. If your dataset is very small, you may need to adjust this parameter accordingly (and other parameters like overlapCutoff) to ensure that you do not have high duplication rates with the same cells participating in many of the cell groupings. These same considerations apply to the getPeak2GeneLinks() function described below.
We can retrieve this co-accessibility information from the ArchRProject via the getCoAccessibility() function which returns a DataFrame object if returnLoops = FALSE.
cA <- getCoAccessibility(
    ArchRProj = projHeme5,
    corCutOff = 0.5,
    resolution = 1,
    returnLoops = FALSE
)
The DataFrame contains a few important pieces of information. The queryHits and subjectHits columns denote the index of the two peaks that were found to be correlated. The correlation column gives the numeric correlation of the accessibility between those two peaks.
cA
## DataFrame with 100410 rows and 11 columns
##        queryHits subjectHits seqnames correlation Variability1 Variability2
##        <integer>   <integer>    <Rle>   <numeric>    <numeric>    <numeric>
## 1              7          13     chr1    0.637747   0.00514607   0.03098155
## 2             13           7     chr1    0.637747   0.03098155   0.00514607
## 3             13          29     chr1    0.599347   0.03098155   0.00440347
## 4             13          38     chr1    0.608207   0.03098155   0.01377298
## 5             25          26     chr1    0.517674   0.02334748   0.00771205
## ...          ...         ...      ...         ...          ...          ...
## 100406    147344      147339     chrX    0.511756   0.00978620   0.01293699
## 100407    147367      147368     chrX    0.563453   0.00169568   0.00155184
## 100408    147368      147367     chrX    0.563453   0.00155184   0.00169568
## 100409    147373      147374     chrX    0.609453   0.01068828   0.00233270
## 100410    147374      147373     chrX    0.609453   0.00233270   0.01068828
##            TStat        Pval         FDR VarQuantile1 VarQuantile2
##        <numeric>   <numeric>   <numeric>    <numeric>    <numeric>
## 1        18.3468 1.21697e-57 1.56304e-55     0.555473     0.929311
## 2        18.3468 1.21697e-57 1.56304e-55     0.929311     0.555473
## 3        16.5906 2.11145e-49 1.84225e-47     0.929311     0.510818
## 4        16.9783 3.33373e-51 3.17421e-49     0.929311     0.792828
## 5        13.4072 3.79464e-35 1.55997e-33     0.884673     0.664324
## ...          ...         ...         ...          ...          ...
## 100406   13.1991 2.93656e-34 1.14815e-32     0.722281     0.780591
## 100407   15.1126 1.19929e-42 7.42944e-41     0.238637     0.216621
## 100408   15.1126 1.19929e-42 7.42944e-41     0.216621     0.238637
## 100409   17.0336 1.84100e-51 1.77552e-49     0.741567     0.324191
## 100410   17.0336 1.84100e-51 1.77552e-49     0.324191     0.741567
This co-accessibility DataFrame also has a metadata component containing a GRanges object of the relevant peaks. The indexes of queryHits and subjectHits mentioned above apply to this GRanges object.
metadata(cA)[[1]]
## GRanges object with 147407 ranges and 0 metadata columns:
##              seqnames              ranges strand
##                 <Rle>           <IRanges>  <Rle>
##         Mono     chr1       752503-753003      *
##            B     chr1       762688-763188      *
##          GMP     chr1       773648-774148      *
##        CD4.M     chr1       779906-780406      *
##            B     chr1       801002-801502      *
##          ...      ...                 ...    ...
##           NK     chrX 154807254-154807754      *
##         PreB     chrX 154840939-154841439      *
##         PreB     chrX 154841881-154842381      *
##           NK     chrX 154842390-154842890      *
##   Progenitor     chrX 154862036-154862536      *
##   -------
##   seqinfo: 23 sequences from an unspecified genome; no seqlengths
If we set returnLoops = TRUE, then getCoAccessibility() will instead return the co-accessibility information in the form a loop track. In this GRanges object, the start and end of the IRanges map to the two different co-accessible peaks for each interaction. The resolution parameter sets the base-pair resolution of these loops. When resolution = 1, this creates loops that connect the center of each peak.
cA <- getCoAccessibility(
    ArchRProj = projHeme5,
    corCutOff = 0.5,
    resolution = 1,
    returnLoops = TRUE
)
We can compare this GRanges object to the DataFrame object generated above.
cA[[1]]
## GRanges object with 50205 ranges and 9 metadata columns:
##           seqnames              ranges strand | correlation Variability1
##              <Rle>           <IRanges>  <Rle> |   <numeric>    <numeric>
##       [1]     chr1       845576-856616      * |    0.637747   0.00514607
##       [2]     chr1       856616-901487      * |    0.599347   0.03098155
##       [3]     chr1       856616-940557      * |    0.608207   0.03098155
##       [4]     chr1       894693-895198      * |    0.517674   0.02334748
##       [5]     chr1       901487-940557      * |    0.579194   0.01377298
##       ...      ...                 ...    ... .         ...          ...
##   [50201]     chrX 153529407-153597283      * |    0.514473   0.00259139
##   [50202]     chrX 153597283-153637642      * |    0.517474   0.09252559
##   [50203]     chrX 153686257-153715023      * |    0.511756   0.01293699
##   [50204]     chrX 153959653-153960340      * |    0.563453   0.00169568
##   [50205]     chrX 153980210-153990364      * |    0.609453   0.01068828
##           Variability2     TStat        Pval         FDR VarQuantile1
##              <numeric> <numeric>   <numeric>   <numeric>    <numeric>
##       [1]   0.03098155   18.3468 1.21697e-57 1.56304e-55     0.555473
##       [2]   0.00440347   16.5906 2.11145e-49 1.84225e-47     0.929311
##       [3]   0.01377298   16.9783 3.33373e-51 3.17421e-49     0.929311
##       [4]   0.00771205   13.4072 3.79464e-35 1.55997e-33     0.884673
##       [5]   0.00440347   15.7437 1.65808e-45 1.18689e-43     0.792828
##       ...          ...       ...         ...         ...          ...
##   [50201]   0.09252559   13.2943 1.15337e-34 4.61541e-33     0.354323
##   [50202]   0.02734691   13.4001 4.06966e-35 1.67015e-33     0.997672
##   [50203]   0.00978620   13.1991 2.93656e-34 1.14815e-32     0.780591
##   [50204]   0.00155184   15.1126 1.19929e-42 7.42944e-41     0.238637
##   [50205]   0.00233270   17.0336 1.84100e-51 1.77552e-49     0.741567
##           VarQuantile2     value
##              <numeric> <numeric>
##       [1]     0.929311  0.637747
##       [2]     0.510818  0.599347
##       [3]     0.792828  0.608207
##       [4]     0.664324  0.517674
##       [5]     0.510818  0.579194
##       ...          ...       ...
##   [50201]     0.997672  0.514473
##   [50202]     0.910198  0.517474
##   [50203]     0.722281  0.511756
##   [50204]     0.216621  0.563453
##   [50205]     0.324191  0.609453
##   -------
##   seqinfo: 23 sequences from an unspecified genome; no seqlengths
This object contains a lot of information that can be helpful in further filtering the returned loops. In addition to filtering based on the correlation between peaks (via the corCutOff parameter), we have found it helpful to limit these analyses to stronger peaks (based on FDR) or loops that show more variability (i.e. higher values for VarQuantile1 and VarQuantile2). For example:
cALoops <- cA[[1]]
cALoops <- cALoops[cALoops$FDR < 10^-10]
cALoops <- cALoops[rowMins(cbind(cALoops$VarQuantile1,cALoops$VarQuantile2)) > 0.35]
cALoops
## GRanges object with 37760 ranges and 9 metadata columns:
##           seqnames              ranges strand | correlation Variability1
##              <Rle>           <IRanges>  <Rle> |   <numeric>    <numeric>
##       [1]     chr1       845576-856616      * |    0.637747   0.00514607
##       [2]     chr1       856616-901487      * |    0.599347   0.03098155
##       [3]     chr1       856616-940557      * |    0.608207   0.03098155
##       [4]     chr1       894693-895198      * |    0.517674   0.02334748
##       [5]     chr1       901487-940557      * |    0.579194   0.01377298
##       ...      ...                 ...    ... .         ...          ...
##   [37756]     chrX 153248873-153306007      * |    0.586708   0.00836791
##   [37757]     chrX 153276018-153306007      * |    0.647290   0.01478763
##   [37758]     chrX 153529407-153597283      * |    0.514473   0.00259139
##   [37759]     chrX 153597283-153637642      * |    0.517474   0.09252559
##   [37760]     chrX 153686257-153715023      * |    0.511756   0.01293699
##           Variability2     TStat        Pval         FDR VarQuantile1
##              <numeric> <numeric>   <numeric>   <numeric>    <numeric>
##       [1]   0.03098155   18.3468 1.21697e-57 1.56304e-55     0.555473
##       [2]   0.00440347   16.5906 2.11145e-49 1.84225e-47     0.929311
##       [3]   0.01377298   16.9783 3.33373e-51 3.17421e-49     0.929311
##       [4]   0.00771205   13.4072 3.79464e-35 1.55997e-33     0.884673
##       [5]   0.00440347   15.7437 1.65808e-45 1.18689e-43     0.792828
##       ...          ...       ...         ...         ...          ...
##   [37756]    0.0117999   16.0541 6.29899e-47 4.84649e-45     0.685606
##   [37757]    0.0117999   18.8168 7.11135e-60 1.01334e-57     0.805730
##   [37758]    0.0925256   13.2943 1.15337e-34 4.61541e-33     0.354323
##   [37759]    0.0273469   13.4001 4.06966e-35 1.67015e-33     0.997672
##   [37760]    0.0097862   13.1991 2.93656e-34 1.14815e-32     0.780591
##           VarQuantile2     value
##              <numeric> <numeric>
##       [1]     0.929311  0.637747
##       [2]     0.510818  0.599347
##       [3]     0.792828  0.608207
##       [4]     0.664324  0.517674
##       [5]     0.510818  0.579194
##       ...          ...       ...
##   [37756]     0.762503  0.586708
##   [37757]     0.762503  0.647290
##   [37758]     0.997672  0.514473
##   [37759]     0.910198  0.517474
##   [37760]     0.722281  0.511756
##   -------
##   seqinfo: 23 sequences from an unspecified genome; no seqlengths
To help with over-plotting of co-accessibility interactions we can decrease the resolution of our loops to resolution = 1000. Below, we see that there are fewer total entries in our GRanges object than above.
cA <- getCoAccessibility(
    ArchRProj = projHeme5,
    corCutOff = 0.5,
    resolution = 1000,
    returnLoops = TRUE
)

cA[[1]]
## GRanges object with 48198 ranges and 9 metadata columns:
##           seqnames              ranges strand | correlation Variability1
##              <Rle>           <IRanges>  <Rle> |   <numeric>    <numeric>
##       [1]     chr1       845500-856500      * |    0.637747   0.00514607
##       [2]     chr1       856500-901500      * |    0.599347   0.03098155
##       [3]     chr1       856500-940500      * |    0.608207   0.03098155
##       [4]     chr1       894500-895500      * |    0.517674   0.02334748
##       [5]     chr1       901500-940500      * |    0.579194   0.01377298
##       ...      ...                 ...    ... .         ...          ...
##   [48194]     chrX 153529500-153597500      * |    0.514473   0.00259139
##   [48195]     chrX 153597500-153637500      * |    0.517474   0.09252559
##   [48196]     chrX 153686500-153715500      * |    0.511756   0.01293699
##   [48197]     chrX 153959500-153960500      * |    0.563453   0.00169568
##   [48198]     chrX 153980500-153990500      * |    0.609453   0.01068828
##           Variability2     TStat        Pval         FDR VarQuantile1
##              <numeric> <numeric>   <numeric>   <numeric>    <numeric>
##       [1]   0.03098155   18.3468 1.21697e-57 1.56304e-55     0.555473
##       [2]   0.00440347   16.5906 2.11145e-49 1.84225e-47     0.929311
##       [3]   0.01377298   16.9783 3.33373e-51 3.17421e-49     0.929311
##       [4]   0.00771205   13.4072 3.79464e-35 1.55997e-33     0.884673
##       [5]   0.00440347   15.7437 1.65808e-45 1.18689e-43     0.792828
##       ...          ...       ...         ...         ...          ...
##   [48194]   0.09252559   13.2943 1.15337e-34 4.61541e-33     0.354323
##   [48195]   0.02734691   13.4001 4.06966e-35 1.67015e-33     0.997672
##   [48196]   0.00978620   13.1991 2.93656e-34 1.14815e-32     0.780591
##   [48197]   0.00155184   15.1126 1.19929e-42 7.42944e-41     0.238637
##   [48198]   0.00233270   17.0336 1.84100e-51 1.77552e-49     0.741567
##           VarQuantile2     value
##              <numeric> <numeric>
##       [1]     0.929311  0.637747
##       [2]     0.510818  0.599347
##       [3]     0.792828  0.608207
##       [4]     0.664324  0.517674
##       [5]     0.510818  0.579194
##       ...          ...       ...
##   [48194]     0.997672  0.514473
##   [48195]     0.910198  0.517474
##   [48196]     0.722281  0.511756
##   [48197]     0.216621  0.563453
##   [48198]     0.324191  0.609453
##   -------
##   seqinfo: 23 sequences from an unspecified genome; no seqlengths
Similarly, if we decrease the resolution even further with resolution = 10000, we identify even fewer co-accessibility interactions.
cA <- getCoAccessibility(
    ArchRProj = projHeme5,
    corCutOff = 0.5,
    resolution = 10000,
    returnLoops = TRUE
)

cA[[1]]
## GRanges object with 33744 ranges and 9 metadata columns:
##           seqnames              ranges strand | correlation Variability1
##              <Rle>           <IRanges>  <Rle> |   <numeric>    <numeric>
##       [1]     chr1       845000-855000      * |    0.637747   0.00514607
##       [2]     chr1       855000-905000      * |    0.599347   0.03098155
##       [3]     chr1       855000-945000      * |    0.608207   0.03098155
##       [4]     chr1              895000      * |    0.517674   0.02334748
##       [5]     chr1       905000-945000      * |    0.579194   0.01377298
##       ...      ...                 ...    ... .         ...          ...
##   [33740]     chrX 153525000-153595000      * |    0.514473   0.00259139
##   [33741]     chrX 153595000-153635000      * |    0.517474   0.09252559
##   [33742]     chrX 153685000-153715000      * |    0.511756   0.01293699
##   [33743]     chrX 153955000-153965000      * |    0.563453   0.00169568
##   [33744]     chrX 153985000-153995000      * |    0.609453   0.01068828
##           Variability2     TStat        Pval         FDR VarQuantile1
##              <numeric> <numeric>   <numeric>   <numeric>    <numeric>
##       [1]   0.03098155   18.3468 1.21697e-57 1.56304e-55     0.555473
##       [2]   0.00440347   16.5906 2.11145e-49 1.84225e-47     0.929311
##       [3]   0.01377298   16.9783 3.33373e-51 3.17421e-49     0.929311
##       [4]   0.00771205   13.4072 3.79464e-35 1.55997e-33     0.884673
##       [5]   0.00440347   15.7437 1.65808e-45 1.18689e-43     0.792828
##       ...          ...       ...         ...         ...          ...
##   [33740]   0.09252559   13.2943 1.15337e-34 4.61541e-33     0.354323
##   [33741]   0.02734691   13.4001 4.06966e-35 1.67015e-33     0.997672
##   [33742]   0.00978620   13.1991 2.93656e-34 1.14815e-32     0.780591
##   [33743]   0.00155184   15.1126 1.19929e-42 7.42944e-41     0.238637
##   [33744]   0.00233270   17.0336 1.84100e-51 1.77552e-49     0.741567
##           VarQuantile2     value
##              <numeric> <numeric>
##       [1]     0.929311  0.637747
##       [2]     0.510818  0.599347
##       [3]     0.792828  0.608207
##       [4]     0.664324  0.517674
##       [5]     0.510818  0.579194
##       ...          ...       ...
##   [33740]     0.997672  0.514473
##   [33741]     0.910198  0.517474
##   [33742]     0.722281  0.511756
##   [33743]     0.216621  0.563453
##   [33744]     0.324191  0.609453
##   -------
##   seqinfo: 23 sequences from an unspecified genome; no seqlengths
17.2.1 Plotting browser tracks of Co-accessibility
Once we have added co-accessibility informtation to our ArchRProject we can use this as a loop track when plotting browser tracks. We do this via the loops parameter to the plotBrowserTrack() function. Here, we are using the default parameters for getCoAccessibility() which include corCutOff = 0.5, resolution = 1000, and returnLoops = TRUE.
markerGenes  <- c(
    "CD34", #Early Progenitor
    "GATA1", #Erythroid
    "PAX5", "MS4A1", #B-Cell Trajectory
    "CD14", #Monocytes
    "CD3D", "CD8A", "TBX21", "IL7R" #TCells
  )

p <- plotBrowserTrack(
    ArchRProj = projHeme5,
    groupBy = "Clusters2",
    geneSymbol = markerGenes,
    upstream = 50000,
    downstream = 50000,
    loops = getCoAccessibility(projHeme5)
)
## ArchR logging to : ArchRLogs/ArchR-plotBrowserTrack-934c920d5-Date-2025-02-06_Time-02-46-52.415133.log
## If there is an issue, please report to github with logFile!
## 2025-02-06 02:46:53.022687 : Validating Region, 0.01 mins elapsed.
## GRanges object with 9 ranges and 2 metadata columns:
##       seqnames              ranges strand |     gene_id      symbol
##          <Rle>           <IRanges>  <Rle> | <character> <character>
##   [1]     chr1 208059883-208084683      - |         947        CD34
##   [2]     chrX   48644982-48652717      + |        2623       GATA1
##   [3]     chr9   36838531-37034476      - |        5079        PAX5
##   [4]    chr11   60223282-60238225      + |         931       MS4A1
##   [5]     chr5 140011313-140013286      - |         929        CD14
##   [6]    chr11 118209789-118213459      - |         915        CD3D
##   [7]     chr2   87011728-87035519      - |         925        CD8A
##   [8]    chr17   45810610-45823485      + |       30009       TBX21
##   [9]     chr5   35856977-35879705      + |        3575        IL7R
##   -------
##   seqinfo: 24 sequences from hg19 genome
## 2025-02-06 02:46:53.094381 : Adding Bulk Tracks (1 of 9), 0.011 mins elapsed.
## 2025-02-06 02:46:55.176209 : Adding Feature Tracks (1 of 9), 0.046 mins elapsed.
## 2025-02-06 02:46:55.25984 : Adding Loop Tracks (1 of 9), 0.047 mins elapsed.
## 2025-02-06 02:46:55.399196 : Adding Gene Tracks (1 of 9), 0.05 mins elapsed.
## 2025-02-06 02:46:55.742377 : Plotting, 0.055 mins elapsed.
## 2025-02-06 02:46:56.541037 : Adding Bulk Tracks (2 of 9), 0.069 mins elapsed.
## 2025-02-06 02:46:58.3216 : Adding Feature Tracks (2 of 9), 0.098 mins elapsed.
## 2025-02-06 02:46:58.405199 : Adding Loop Tracks (2 of 9), 0.1 mins elapsed.
## 2025-02-06 02:46:58.591959 : Adding Gene Tracks (2 of 9), 0.103 mins elapsed.
## 2025-02-06 02:46:58.796852 : Plotting, 0.106 mins elapsed.
## 2025-02-06 02:46:59.689016 : Adding Bulk Tracks (3 of 9), 0.121 mins elapsed.
## 2025-02-06 02:47:01.491356 : Adding Feature Tracks (3 of 9), 0.151 mins elapsed.
## 2025-02-06 02:47:01.577291 : Adding Loop Tracks (3 of 9), 0.153 mins elapsed.
## 2025-02-06 02:47:02.074779 : Adding Gene Tracks (3 of 9), 0.161 mins elapsed.
## 2025-02-06 02:47:02.274246 : Plotting, 0.164 mins elapsed.
## 2025-02-06 02:47:03.255812 : Adding Bulk Tracks (4 of 9), 0.181 mins elapsed.
## 2025-02-06 02:47:05.0556 : Adding Feature Tracks (4 of 9), 0.211 mins elapsed.
## 2025-02-06 02:47:05.139917 : Adding Loop Tracks (4 of 9), 0.212 mins elapsed.
## 2025-02-06 02:47:05.404111 : Adding Gene Tracks (4 of 9), 0.217 mins elapsed.
## 2025-02-06 02:47:05.605285 : Plotting, 0.22 mins elapsed.
## 2025-02-06 02:47:06.370167 : Adding Bulk Tracks (5 of 9), 0.233 mins elapsed.
## 2025-02-06 02:47:08.110441 : Adding Feature Tracks (5 of 9), 0.262 mins elapsed.
## 2025-02-06 02:47:08.194293 : Adding Loop Tracks (5 of 9), 0.263 mins elapsed.
## 2025-02-06 02:47:08.608782 : Adding Gene Tracks (5 of 9), 0.27 mins elapsed.
## 2025-02-06 02:47:08.812891 : Plotting, 0.273 mins elapsed.
## 2025-02-06 02:47:09.633111 : Adding Bulk Tracks (6 of 9), 0.287 mins elapsed.
## 2025-02-06 02:47:09.581985 : Adding Feature Tracks (6 of 9), 0.286 mins elapsed.
## 2025-02-06 02:47:09.659093 : Adding Loop Tracks (6 of 9), 0.287 mins elapsed.
## 2025-02-06 02:47:10.1937 : Adding Gene Tracks (6 of 9), 0.296 mins elapsed.
## 2025-02-06 02:47:10.388781 : Plotting, 0.3 mins elapsed.
## 2025-02-06 02:47:11.182084 : Adding Bulk Tracks (7 of 9), 0.313 mins elapsed.
## 2025-02-06 02:47:13.100951 : Adding Feature Tracks (7 of 9), 0.345 mins elapsed.
## 2025-02-06 02:47:13.180962 : Adding Loop Tracks (7 of 9), 0.346 mins elapsed.
## 2025-02-06 02:47:13.970203 : Adding Gene Tracks (7 of 9), 0.359 mins elapsed.
## 2025-02-06 02:47:14.175013 : Plotting, 0.363 mins elapsed.
## 2025-02-06 02:47:15.095396 : Adding Bulk Tracks (8 of 9), 0.378 mins elapsed.
## 2025-02-06 02:47:16.848731 : Adding Feature Tracks (8 of 9), 0.407 mins elapsed.
## 2025-02-06 02:47:16.929622 : Adding Loop Tracks (8 of 9), 0.409 mins elapsed.
## 2025-02-06 02:47:17.552829 : Adding Gene Tracks (8 of 9), 0.419 mins elapsed.
## 2025-02-06 02:47:17.765846 : Plotting, 0.423 mins elapsed.
## 2025-02-06 02:47:18.767357 : Adding Bulk Tracks (9 of 9), 0.439 mins elapsed.
## 2025-02-06 02:47:20.563891 : Adding Feature Tracks (9 of 9), 0.469 mins elapsed.
## 2025-02-06 02:47:20.645648 : Adding Loop Tracks (9 of 9), 0.471 mins elapsed.
## 2025-02-06 02:47:21.197408 : Adding Gene Tracks (9 of 9), 0.48 mins elapsed.
## 2025-02-06 02:47:21.391975 : Plotting, 0.483 mins elapsed.
## ArchR logging successful to : ArchRLogs/ArchR-plotBrowserTrack-934c920d5-Date-2025-02-06_Time-02-46-52.415133.log
To plot our browser track we use the grid.draw function and select a specific marker gene by name using the $ accessor.

To save an editable vectorized version of this plot, we use plotPDF().
plotPDF(plotList = p,
    name = "Plot-Tracks-Marker-Genes-with-CoAccessibility.pdf",
    ArchRProj = projHeme5,
    addDOC = FALSE, width = 5, height = 5)
## Plotting Gtable!
## NULL
## Plotting Gtable!
## NULL
## Plotting Gtable!
## NULL
## Plotting Gtable!
## NULL
## Plotting Gtable!
## NULL
## Plotting Gtable!
## NULL
## Plotting Gtable!
## NULL
## Plotting Gtable!
## NULL
## Plotting Gtable!
## NULL